Interactive · 6 questions
+5 contributors



Linear and Non-Linear Functions
Before we talk about linear vs. nonlinear functions, let's quickly review just what a function is.

Image source: by Hannah Bonville
In math, think of a function like a little machine. We give it an input. The job of the function is to produce an output for each input we give it.
If the input is like a penny into a gumball machine, then the output is like the gumball. The function is the gumball machine itself - the thing changing the input to the output.
Here's an example of a simple function:

Image source: By Hannah Bonville
Linear Functions
Linear functions are functions that appear as straight lines when they are graphed.
Because of this, linear functions follow the standard equation of a line, which is called "slope-intercept form". Even if an equation doesn't look like it's in slope-intercept form when you first see it, you can almost always transform it to get it there, using the Addition and Subtraction Property of Equality and the Multiplication and Division Property of Equality.

Image source: By Hannah Bonville

Made using Desmos
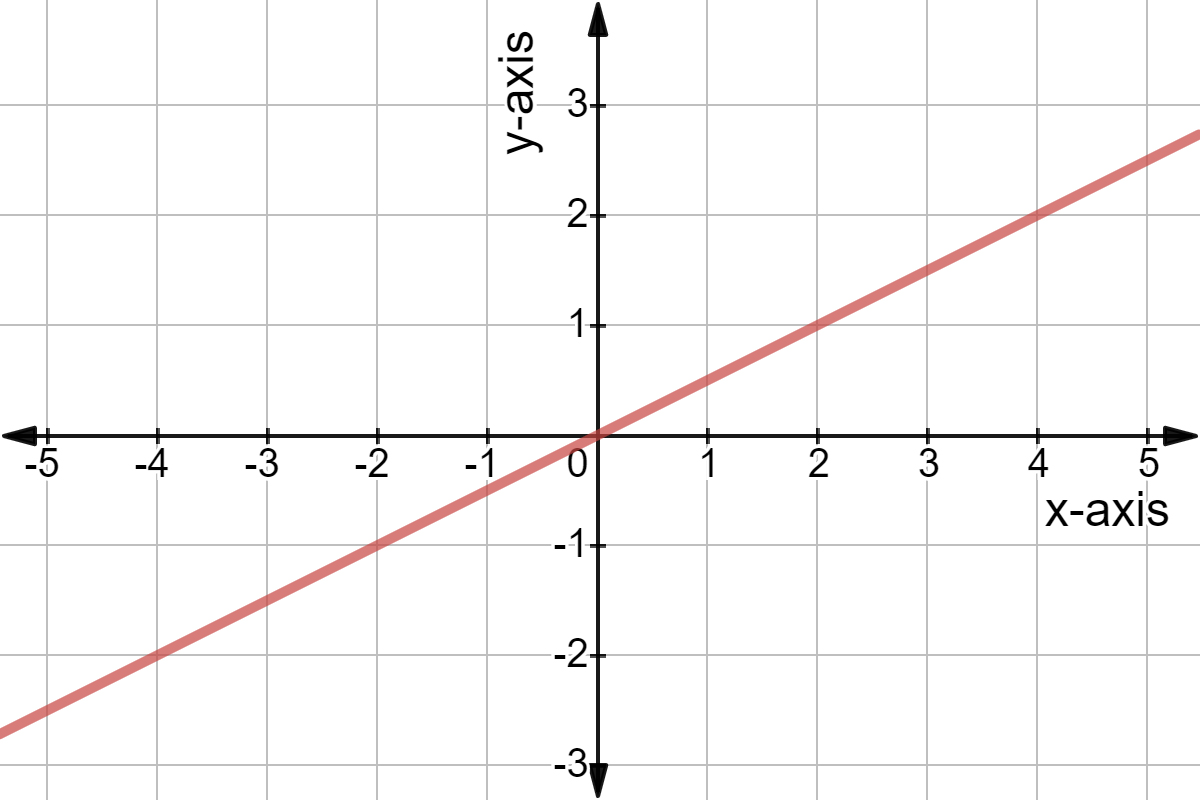
Consider the two functions graphed above in red and blue. Which function is linear?
The equation for the red function is .
What is the slope of the line of this function?
Of the two functions above, which one has a -intercept of ?
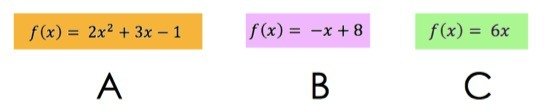
Image source: by Hannah Bonville
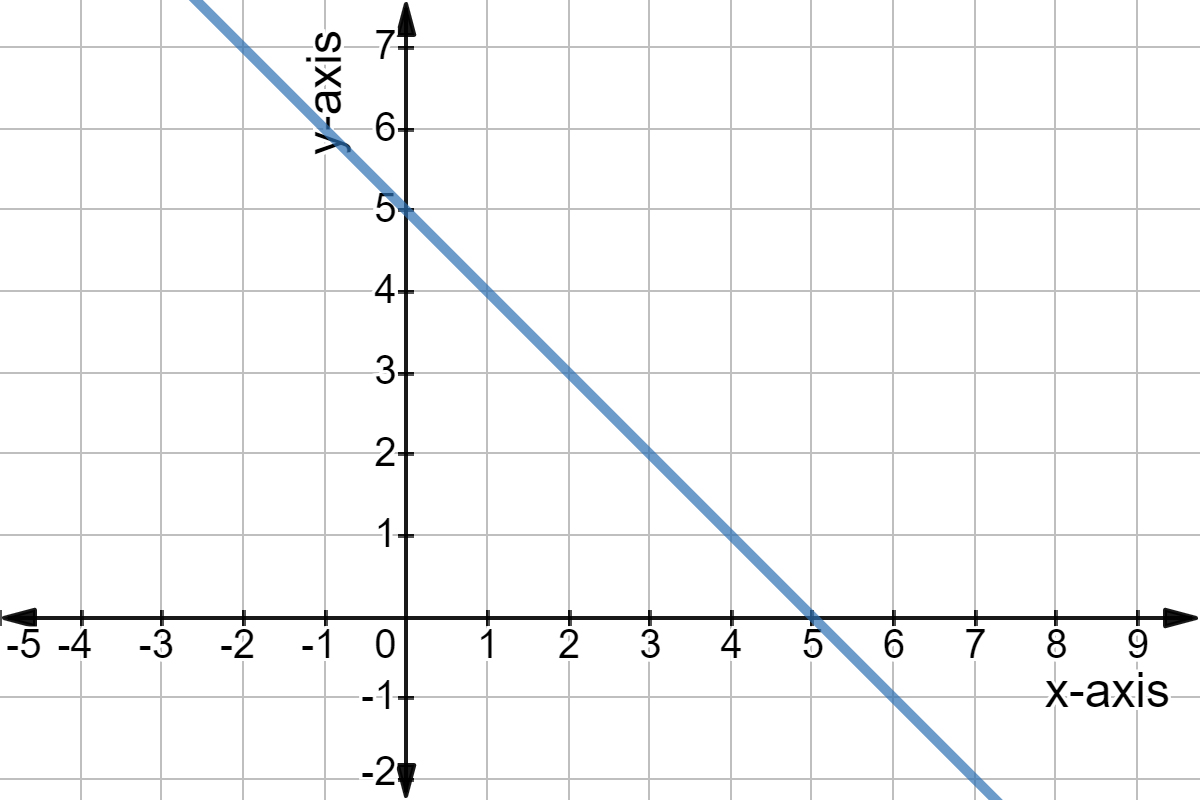
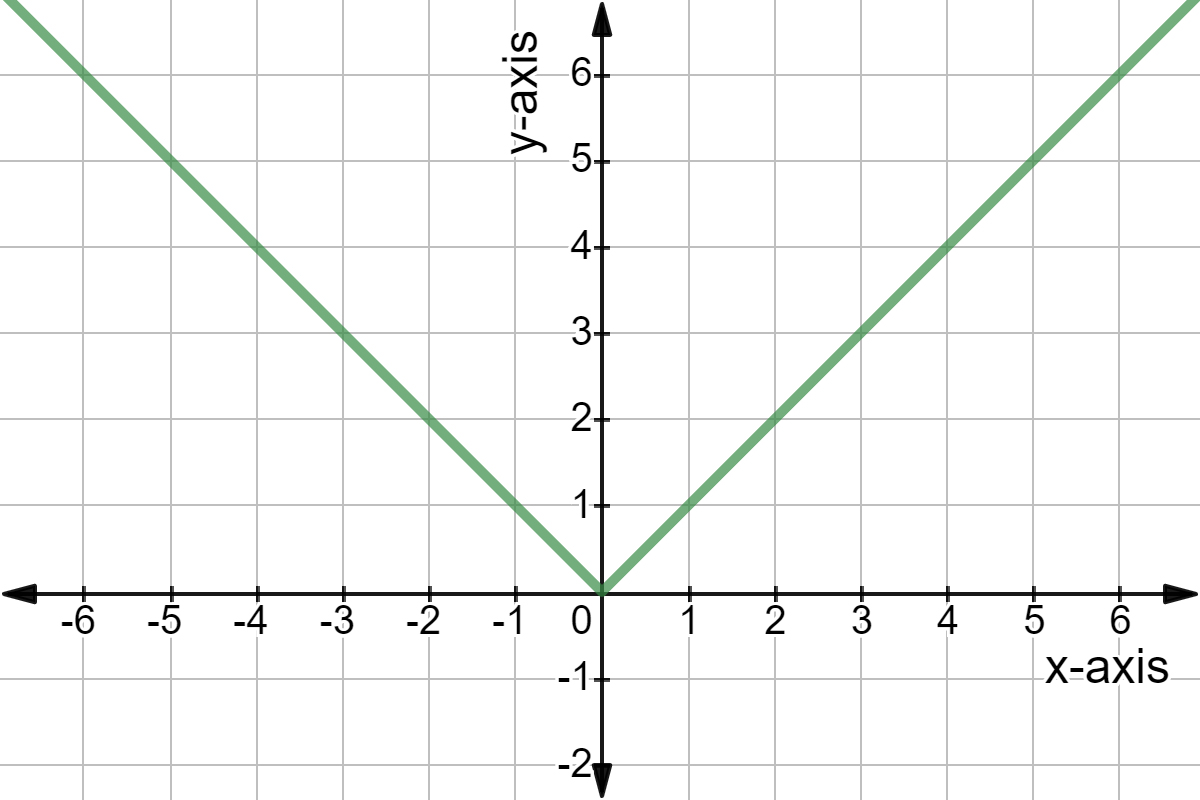
Which of the functions above is a linear function? (Check them off)
Function and Function are linear functions, because they fit into that point-slope form template (think of as having for ). No matter what you do you won't be able to get Function to fit into that form!
Nonlinear Functions
Nonlinear functions are those that are NOT straight lines when they are graphed.
Because of this, nonlinear functions have many forms. They do not follow the equation of a line.
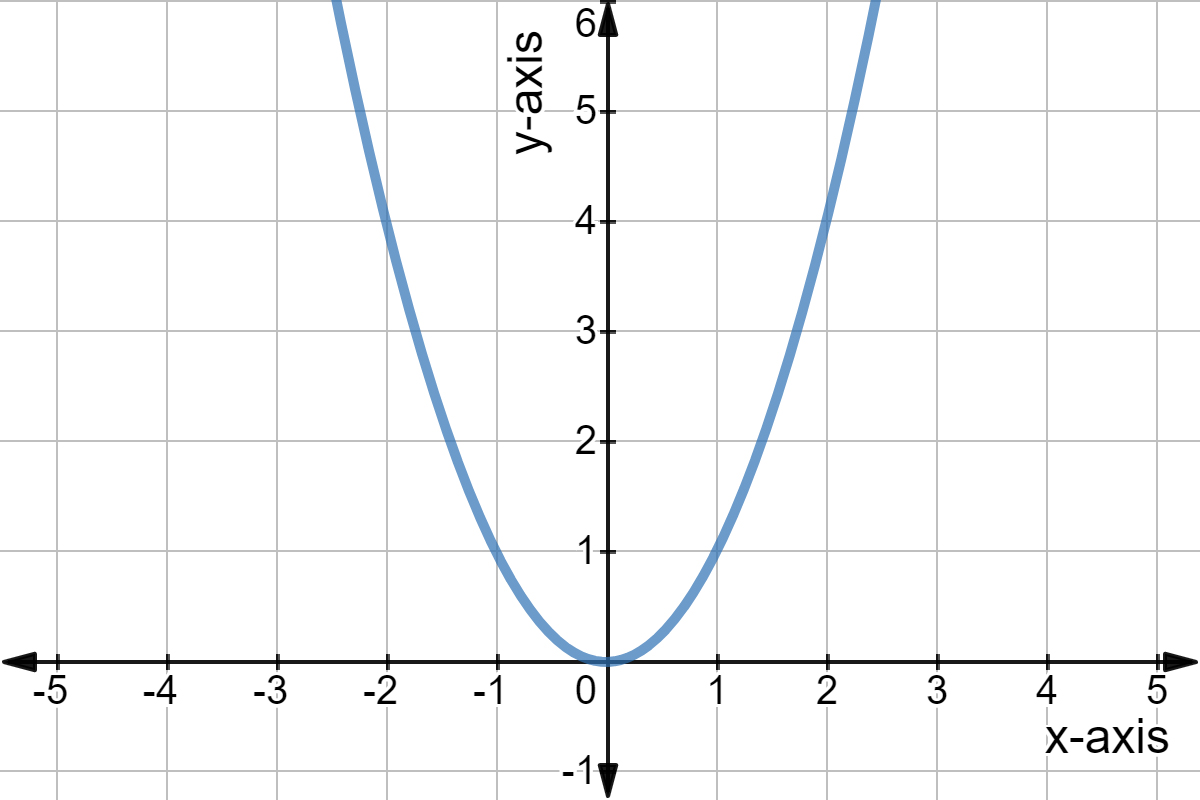
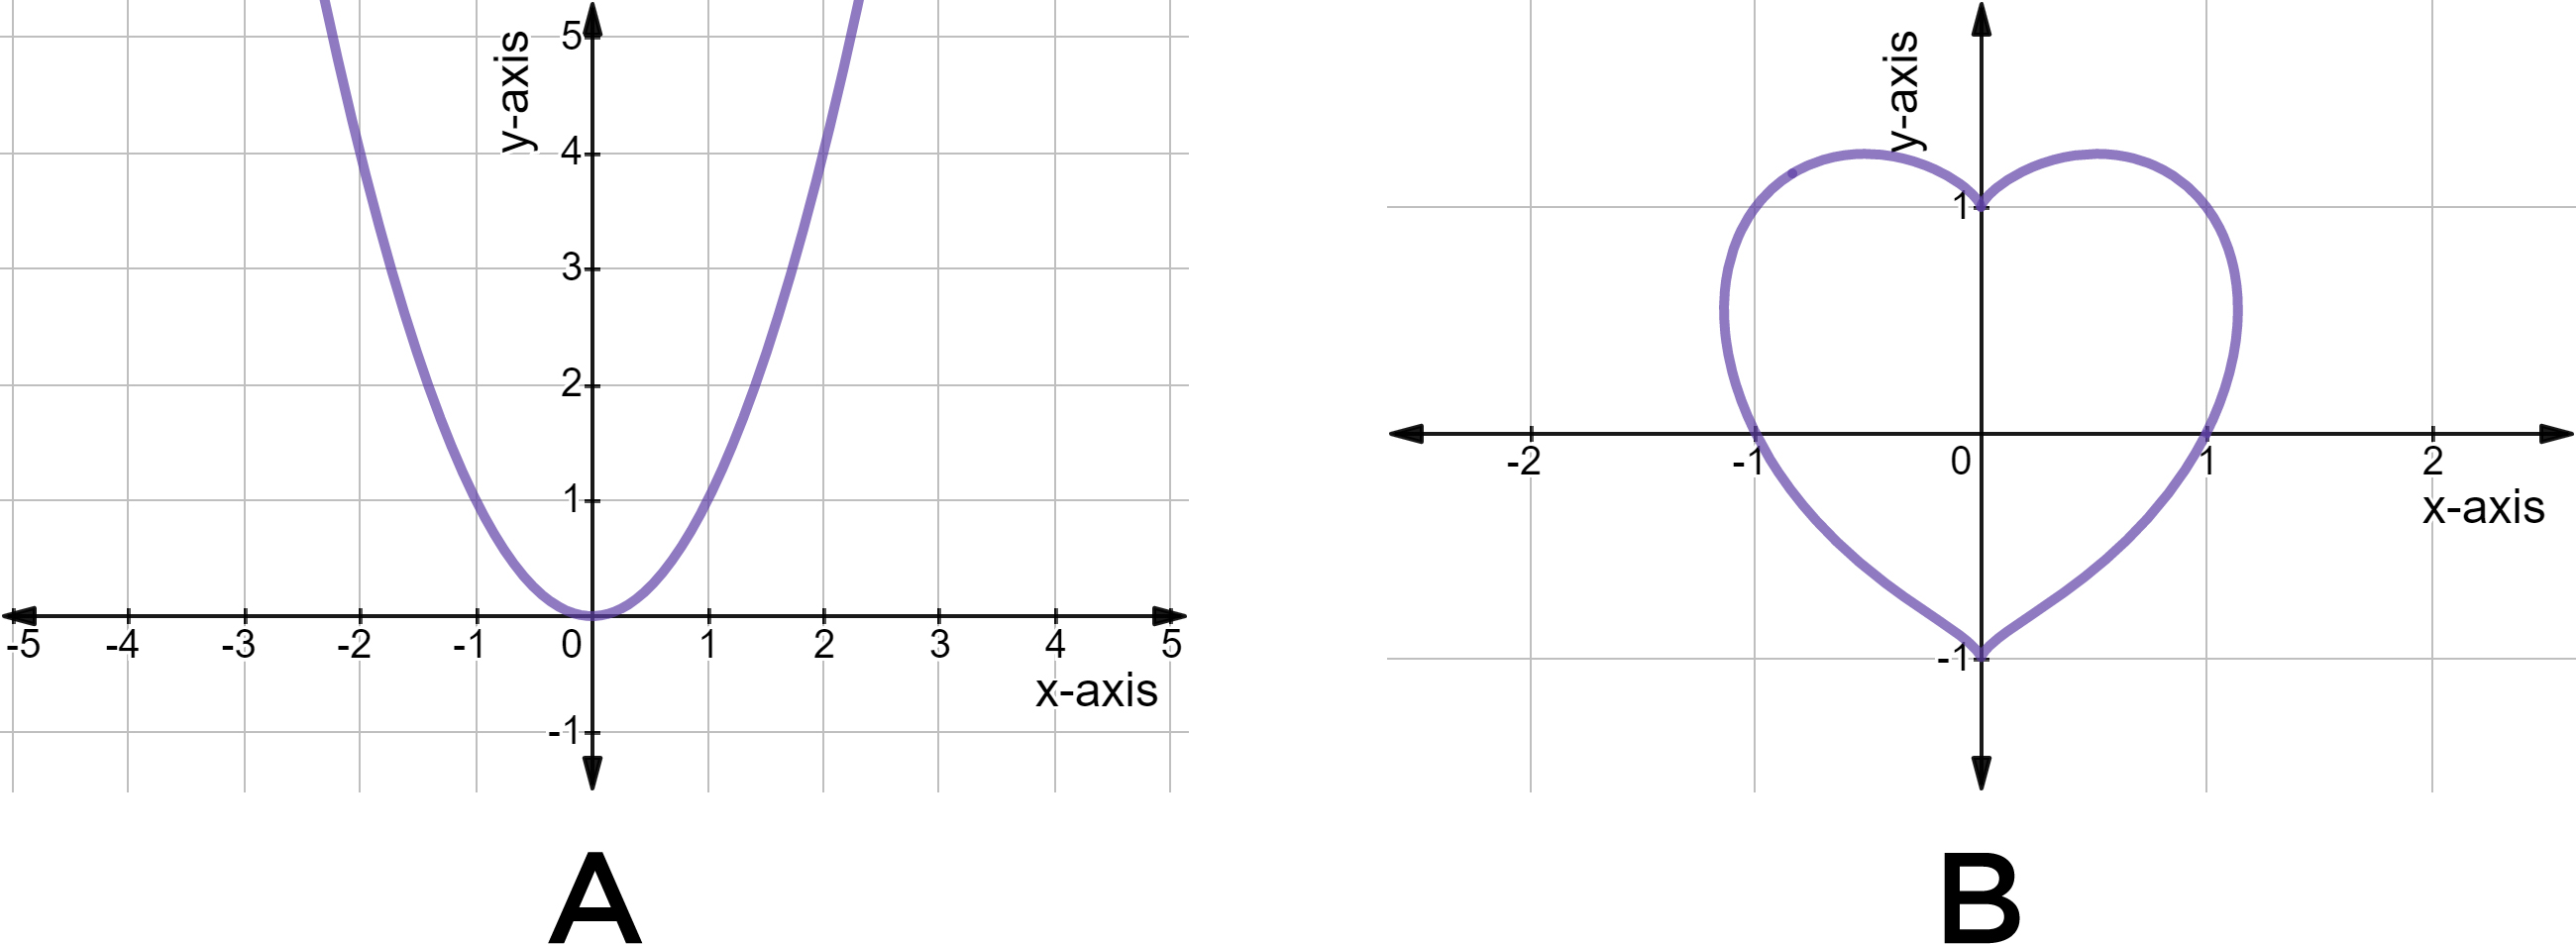
There are many standard non-linear functions, such as quadratic equations.
Made using Desmos
Which of the two graphs above shows a nonlinear function? (Hint: First check whether each graph shows a function. Then check whether that function is linear or nonlinear.)
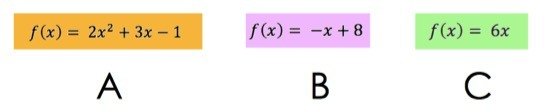
Image source: By Hannah Bonville
Which of the functions above is nonlinear? (Check them off)