Квадратичні функції: швидкість зростання

Interactive · 2 questions

When a line is straight, we can say that its rate of change is constant, that it's the same between any two points on the line.

Graph of y=2x+1

Graph of y=2x+1y=2x+1

made using Desmos

We can see that the straight line doesn't increase or decrease any faster or slower at any point. It's always increasing or decreasing at the same rate.

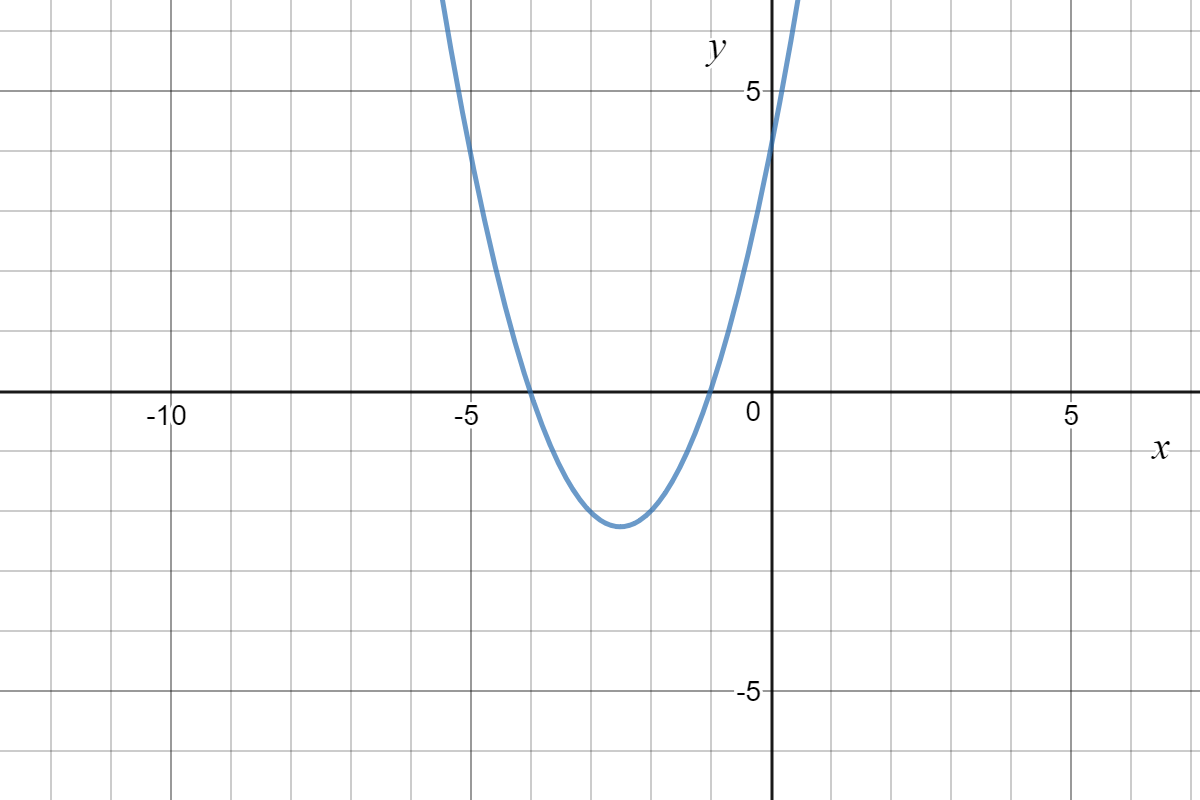
With quadratic equations, the graphs are in the shape of parabolas (U-shapes). In the case of parabolas, the rate of change isn't constant. Take a look:

Graph of y=x^2+1

Graph of y=x2+1y=x^2+1

made using Desmos

Notice how the parabola doesn't increase or decrease at the same rate over the whole graph. So, we need a way to calculate the rate of change for a quadratic expression.

Let's talk about it :)
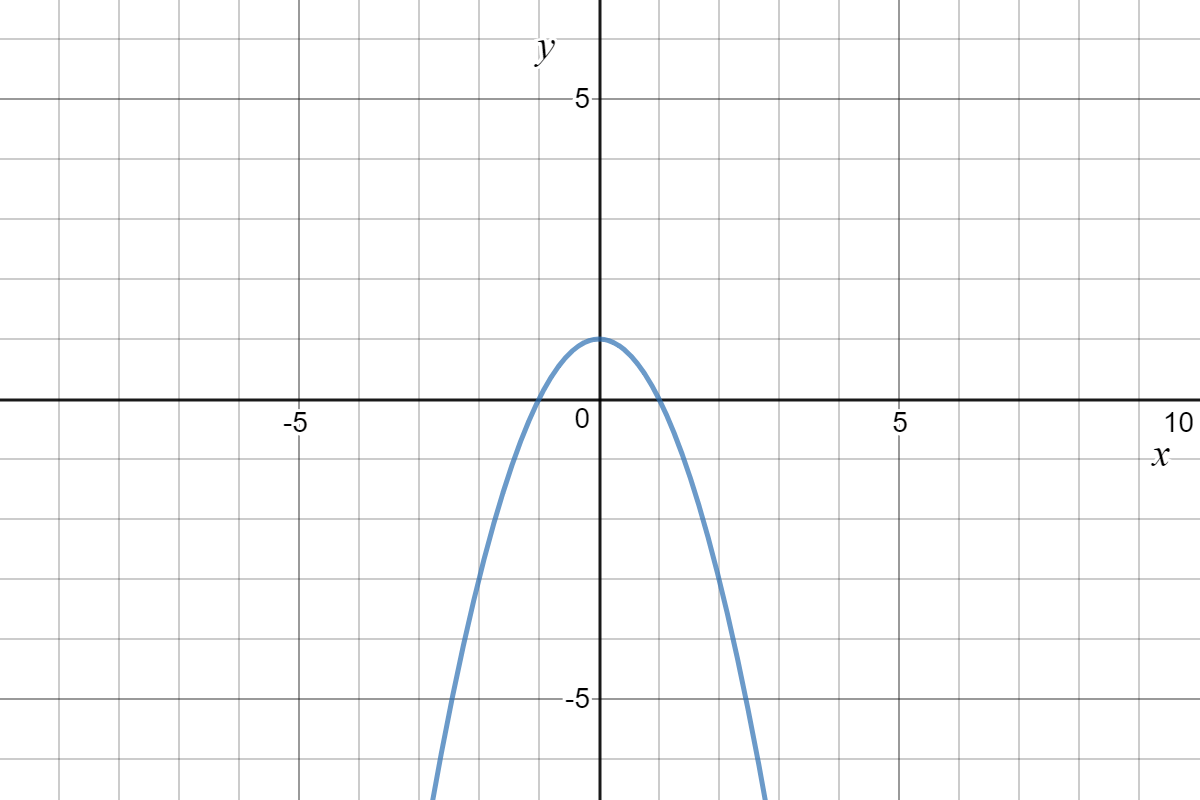
Graph of y=-x^2+1

Graph of y=−x2+1y=-x^2+1

made using Desmos

Consider the graph above. Does it show a constant rate or change or not?

Choose one answer

Illustrated · 1 min

Rates of increase is a small part of quadratic functions but a very interesting and powerful one. Rates of increase is all about the change of one variable as the other increases. An easy way to see this is by making tables.

In this example, we will look at a rock thrown up into the air with an initial velocity of 50m/s250m/s^2. It's height, h(t)h(t) can be modeled by the equation:h(t)=−5t2+50th(t)=-5t^2+50tLet's make tables for the height of the rock during the first 5 seconds and the rate of change of the rock over every second passed.

(Time, Height) pairs: (0, 0), (1, 45), (2, 80), (3, 105), (4, 120), (5, 125); (Time Interval, Average rate of change) pairs: (0->1, 45), (1 -> 2, 35), (2 -> 3, 25), (3 -> 4, 15), (4 -> 5, 5)

Tables for rock thrown in the air

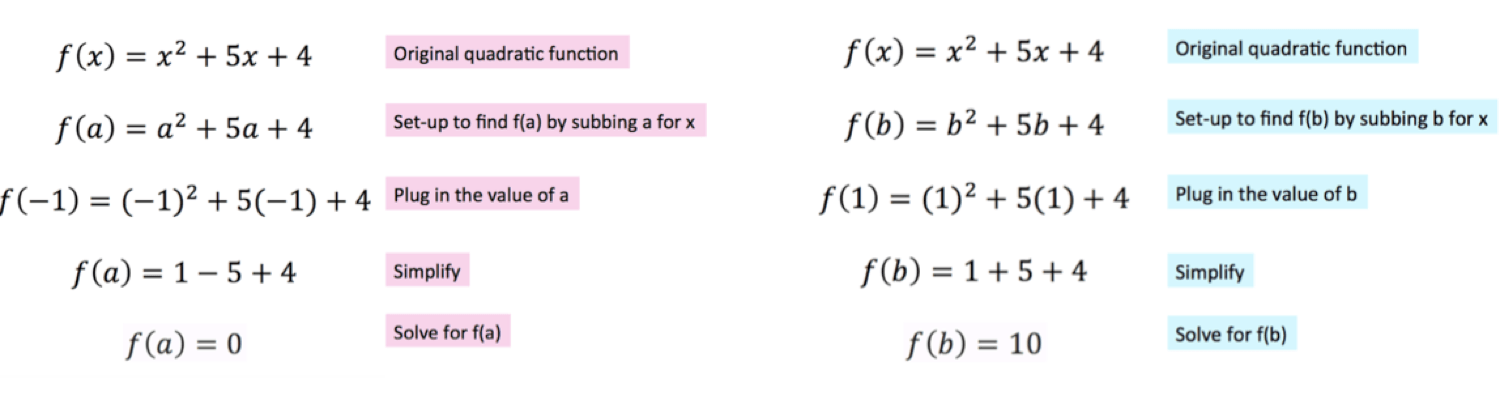
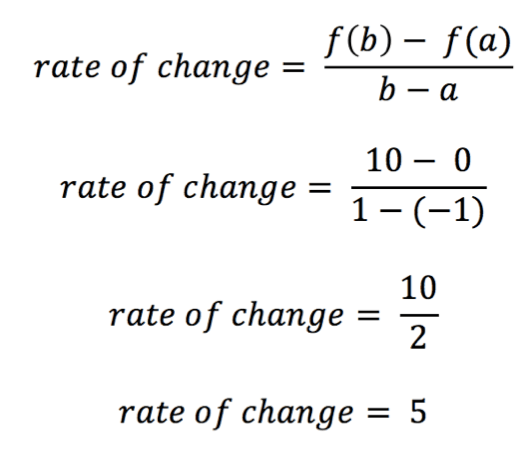
The values in the first table can be found by simply entering t into h(t)h(t). The second table is a bit trickier, but still not hard to figure out. If you want to find the rate of change from one time to another, the formula is: (h2−h1)(t2−t1)\frac{(h_2-h_1)}{(t_2-t_1)}Now, this isn't actually another formula you have to memorize. If you notice, it is the same as the slope formula. For this example, the way to evaluate rates of change is you have to look at a change in height over the same length time intervals.

Graph of h(x) = -5x^2 + 50x

Graph courtesy of Desmos

This is a graph of h(t)=−5t2+50th(t)=-5t^2+50t. The xx-axis is time in seconds, and the yy-axis is height in meters with each tick being 1010 meters.

When we look at a graph of h(t)h(t), we see that the change in height is decreasing at higher values of tt (on the xx-axis in this case) but the overall height is still increasing.

Video

(Video) Finding the Average Rate of Change Between Two Points on a Quadratic Function

by Phil Clark

In this video, we learn about rate of change or rate of increase in a quadratic function.

Summary\large{\text{Summary}}

Rate of change is very similar to rate of increase of a quadratic. This video shows how to find the rate of change between two points of a parabola using the slope formula. When we solve the problem, we get 99 thousands of dollars per 100100 T.V.'s. So, the average rate of change is 90009000 dollars per 100100 T.V.'s. Therefore, we know the revenue is increasing on average (because it is a parabola, not a line) by 9090 dollars per T.V.

Interactive · 1 question

In mathematics, a function or sequence is said to exhibit quadratic growth when its values are proportional to the square of the function argument or sequence position. "Quadratic growth" often means more generally "quadratic growth in the limit", as the argument or sequence position goes to infinity – in big Theta notation, f(x)=Θ(x2)f(x)= \Theta(x^2). This can be defined both continuously (for a real-valued function of a real variable) or discretely (for a sequence of real numbers, i.e., real-valued function of an integer or natural number variable).

In practice, we often look at a collection of data in real life. If we can find a quadratic function that approximates the data well, then we say the data has quadratic growth. That is, we should be able to plot the data and the function together, and the function should come close to hitting all of the data points.

As far as a rate of increase is concerned, we define it as follows: we pick two points in time for which we have data, and call them ss and t.t. If our data is given by the function ff, then the rate of increase between ss and tt is

f(t)−f(s)t−s.\frac{f(t) - f(s)}{t - s}.

If we pick different values of ss and tt, this quantity should change. The only time it won't is if the function we are modeling is a straight line (perhaps a linear function, or a constant function).

What is the rate of increase of f(x)=x2f(x) = x^2 between x=1x = 1 and x=2?x = 2?

Choose one answer

Type a concept, like “slope” or “photosynthesis”.

↑ ↓ to choose · Enter to openSearch explanations and problems