Як аналізувати графік нев'язки

Before this, knowНев'язка

Illustrated · 1 min

What is a Residual Plot?

Simply put, it is a graph showing all the residual values from your scatter plot.

How to Create One

To begin, suppose we have a standard scatter plot and a trend line.

A scatter plot with points: (1,2), (2,4), (3,3), (4,3), (5,4.5), (6,6), (7.6,5), and (8,4).

A trend line of y = 0.5x + 2.

We first want to calculate the residual of each point of data on the scatter plot. Recall the equation for a residual: residual=actual y-value−predicted y-value\text{residual}=\text{actual }y\text{-value}-\text{predicted }y\text{-value} xactualpredictedresidual122.52−2.5=−0.52434−3=1333.53−3.5=−0.54343−4=−154.54.54.5−4.5=06656−5=176.55.56.5−5.5=18464−6=−2\begin{array}{|c|c|} \hline x&\text{actual}&\text{predicted}&\text{residual}\\ \hline 1&2&2.5&2-2.5=-0.5\\ 2&4&3&4-3=1\\ 3&3&3.5&3-3.5=-0.5\\ 4&3&4&3-4=-1\\ 5&4.5&4.5&4.5-4.5=0\\ 6&6&5&6-5=1\\ 7&6.5&5.5&6.5-5.5=1\\ 8&4&6&4-6=-2\\ \hline \end{array}

Next, we plot the residual values on their own graph. The xx-coordinate stays the same and the yy-coordinate is the residual value.

A residual plot.

Voilà!

That's Cool but What Does This Tell Us?

Don't worry, there is a use for this. Residual plots actually tell us whether or not the model we used for a trend line is a good fit.

If our plot has a random scattering of points, like in the graph above, it tells us that a linear model is a good choice for the data. In other words, since the plot shows no pattern, we know that a straight line will represent the data the best.

If the residuals take on a pattern like a U-shape or upside-down-U-shape, then this tells us a nonlinear equation fits our model better. This could be a quadratic function for example.

Residual plot with U-shaped pattern.

Here's an example of a residual plot with a U-shaped pattern. This tells us a nonlinear model with fit the scatter plot's data better.

Interactive · 1 question

Making a Residual Plot \\

A residual plot helps us assess the line of best fit or trend line we have drawn—how good, or accurate is it?

It is a plot of residual values. Let's start from a standard scatter plot with a line of best fit and construct a residual plot.

A scatter plot with a line of best fit.

A scatter plot with a line of best fit.

Constructing and Reading the Residual Plot

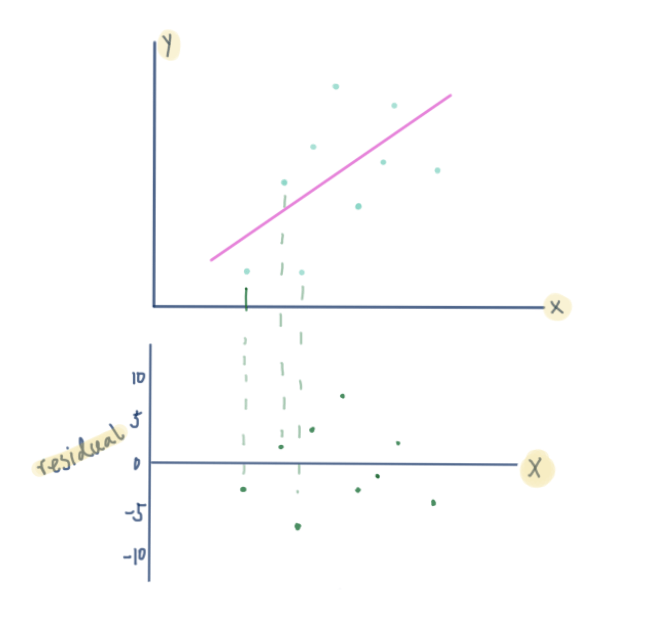
We construct our residual plot based on this scatter plot. In a residual plot, we are only interested in what the residual values are. In a way, it is similar to tilting your head and treating the line of best fit as the xx-axis and the residuals are the points.

Keep in mind that Residual=Observed−Predicted\text{Residual} = \text{Observed}-\text{Predicted}

Turning a scatter plot into a residual plot.

Now, let's take a look at the residual plot.

A residual plot.

When the points are more or less randomly scattered on the plot, it means the linear model is a decent fit for the data.

However, what if there is a shape?

A quadratic residual plot.

Images by: Christine

Like this one above, the residuals are in an upward U-shape—this is an indication that we should change to a non-linear model.

The linear model is a good fit if it shows _.

Choose one answer

Illustrated · 2 min

Residual plots

Before diving into analyzing residual plots, let's review.

Whenever we plot either a line of best fit or a trend line for a scatter plot, we find that not every point in the plot ends up on that line. The vertical difference between the **expected value ** (the point on the line) and the actual value (the value in the scatter plot) is called the residual value. residual=actual y-value−predicted y-value\text{residual}=\text{actual }y\text{-value}-\text{predicted }y\text{-value}

Each point in a scatter plot has a residual value. It will be positive if it falls above the line of best fit and negative if it falls below that line. In the case that the expected value and the actual value are equal (i.e. the line passes through a point on the scatter plot), the residual value is zero.

Scatter plot with a trend line. A residual is illustrated.

Analyzing residual plots

All of the residual values can be plotted on a graph called a residual plot. This is done by treating the trend line as the xx-axis. It gives us a better idea of how well the trend line fits the scatter plot.

To construct this type of plot, first find the residuals of all the points on your scatter plot. xactual ypredicted yresidual2353−5=−2456.255−6.25=−1.25566.8756−6.875=−0.875687.58−7.5=0.5818.751−8.75=−7.75999.3759−9.375=−0.3759129.37512−9.375=2.62510151015−10=511910.6259−10.625=−1.625131811.87518−11.875=6.125142212.522−12.5=9.515813.1258−13.125=−5.125189159−15=−6\begin{array}{|c|c|c|c|} \hline x&\text{actual }y&\text{predicted }y&\text{residual}\\ \hline 2&3&5&3-5=-2\\ 4&5&6.25&5-6.25=-1.25\\ 5&6&6.875&6-6.875=-0.875\\ 6&8&7.5&8-7.5=0.5\\ 8&1&8.75&1-8.75=-7.75\\ 9&9&9.375&9-9.375=-0.375\\ 9&12&9.375&12-9.375=2.625\\ 10&15&10&15-10=5\\ 11&9&10.625&9-10.625=-1.625\\ 13&18&11.875&18-11.875=6.125\\ 14&22&12.5&22-12.5=9.5\\ 15&8&13.125&8-13.125=-5.125\\ 18&9&15&9-15=-6\\ \hline \end{array} Now, we plot these residuals using the xx-coordinate they're at and the residual value as the yy-coordinate.

The graph below is an example of a residual plot for the scatter plot shown above.

Residual plot.

By studying the data on the residual plot we can decide if the trend line is the best fit for the data. If it has a random distribution of points, it tells us that a linear function is best for the line of best fit.

In this example, the residual points seem randomly distributed. So our linear line of best fit is a good choice. We can also see it predicts the earlier values better but becomes more inaccurate as we increase xx-values.

Video

(Video) Interpreting Residual Plots

by MareeBerry

This video by MareeBerry looks at residual plots.

Residual plots are essential what happens when you take a normal scatterplot and tilt it horizontally. The video gives some examples and practice of matching the scatterplot to the residual plot.

Residual plots that have points that are closer to the line of best fit is a better model. Residual plots that have points that are further from the line of best fit are not as good models. A perfect model would be when all points on a residual plot match the line of best fit.

Type a concept, like “slope” or “photosynthesis”.

↑ ↓ to choose · Enter to openSearch explanations and problems