Точкові діаграми

Video

Correlation Does Not Mean Causation

Before we begin, here's a quick overview of everything related to correlation and causation.

∘\href∘\href∘\href∘\href∘\href✓Causation\begin{align} &\circ\quad\small{\href{https://www.expii.com/t/scatter-plots-4393?type=explanation&id=7653}{\text{Scatter Plots}}}\\ &\circ\quad\small{\href{https://www.expii.com/t/scatter-plot-graph-correlation-4394?type=explanation&id=7667}{\text{Correlation}}}\\ &\circ\quad\small{\href{https://www.expii.com/t/trend-lines-graph-4395?type=explanation&id=7664}{\text{Trend Lines}}}\\ &\circ\quad\small{\href{https://www.expii.com/t/line-of-best-fit-equation-4396?type=explanation&id=7666}{\text{Line of Best Fit}}}\\ &\circ\quad\small{\href{https://www.expii.com/t/line-of-best-fit-equation-4396?type=explanation&id=7668}{\text{Interpolation and Extrapolation}}}\\ &\color{green}{\checkmark}\quad\small{\text{Causation}}\\ \end{align}

You might have heard this expression before, and it is a really important one. Just because two things have a correlation, it doesn't mean one causes the other to happen.

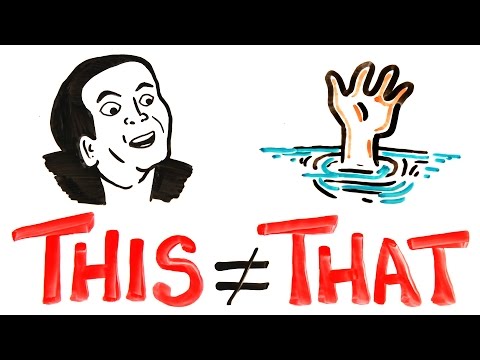
One of my favorite correlations is the number of movies Nic Cage is in each year and the number of drownings. They are positively correlated, meaning as Nic Cage makes more movies within a year, more people drown each year. But this doesn't mean that Nic Cage is the cause of these drownings, that's ridiculous. Sometimes in our chaotic world, things just line up like that.

To truly figure out if something causes something else, we need to do more test, more simulations, and more math!

(Video) This and That

by AsapSCIENCE

Video · + 1 min read

(Video) How Do You Use a Scatter Plot?

by eHow

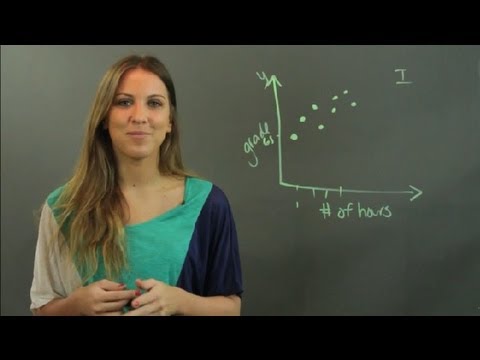
Maria from eHow Education has a great, quick video that explains what a scatter plot is and when to use it.

Summary\large{\text{Summary}}

A scatter plot is used to determine whether two variables have a correlation.

For example, in the video she looks to see if there's a correlation between the number of hours studied, and the grade received on a test.

Here's the outline of our graph. The x-axis is number of hours and the y-axis is grade.

Made using Desmos

Here's the axes of our graph.

Next, we plot our data.

Scatter plot with points (1,65), (2,70), (3,75), (4,68), (5,80), (6,83), (4.5,72), and (5.5,78).

Made using Desmos

Looking at these points we see there is a relationship. Not a direct correlation, though; there are other factors that play a part in the grade of your test. Just because people studied longer doesn't necessarily mean they get a higher grade. The person who studied for 33 hours got a higher grade than the person who studied for 44 hours.

But, on average, the people who studied longer, got higher grades. We call this a trend. We can eventually use a line of best fit to model the relation which we learn about later.

Video · + 1 min read

(Video) Scatter Diagrams

by HEGARTYMATHS

Here's a video by HEGARTYMATHS explaining scatter plots and different questions they can ask you about the diagrams.

Summary\large{\text{Summary}}

A scatter plot is used to plot two variables against each other. There are three different types:

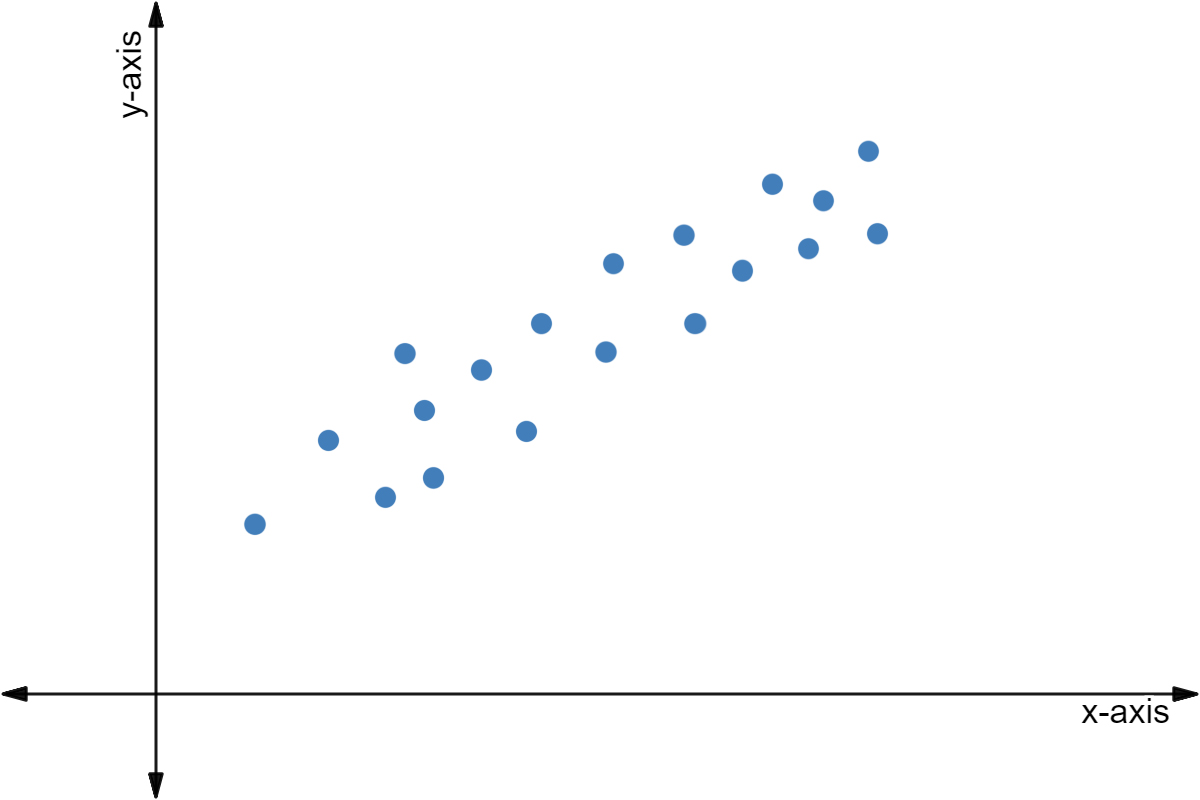
  1. A positive correlation happens when, as your xx values increase, so do your yy values. Hour studying and test score could have a positive correlation.
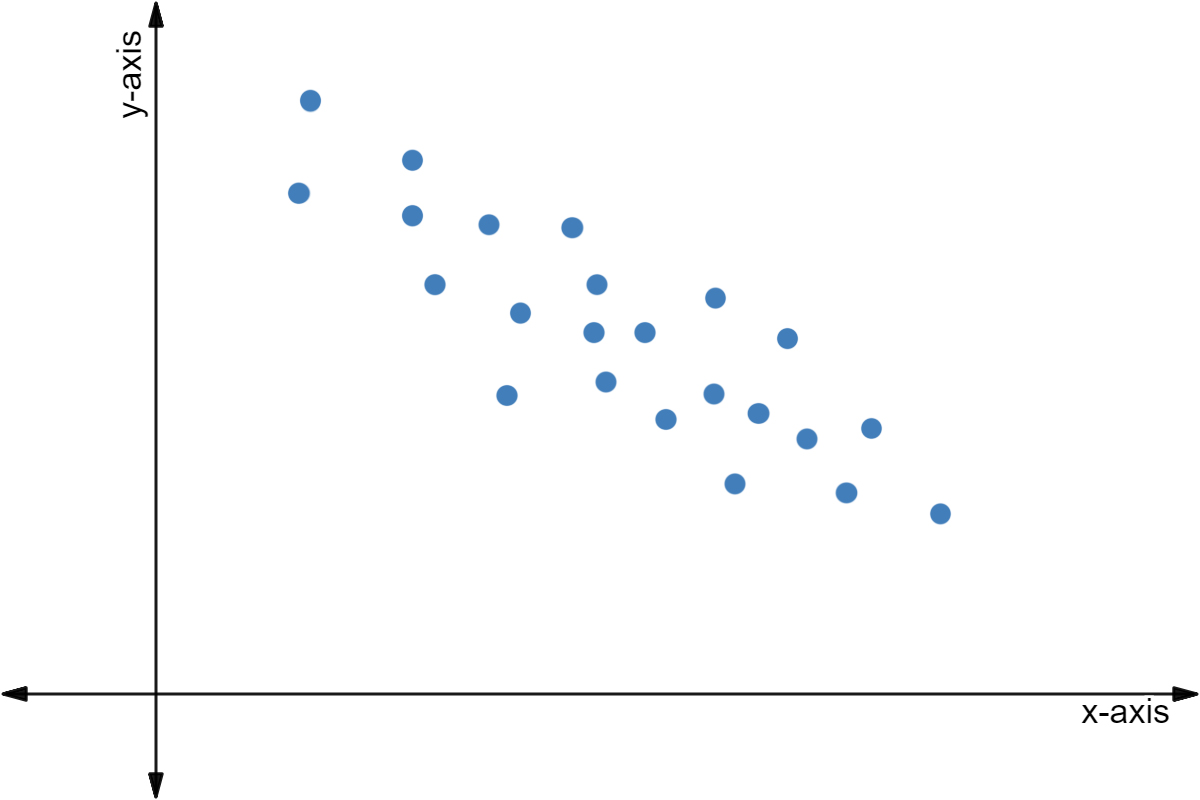
  2. A negative correlation happens when, as your xx values increase, your yy values decrease. Hours spent reading and pages left in your book could have a negative correlation.
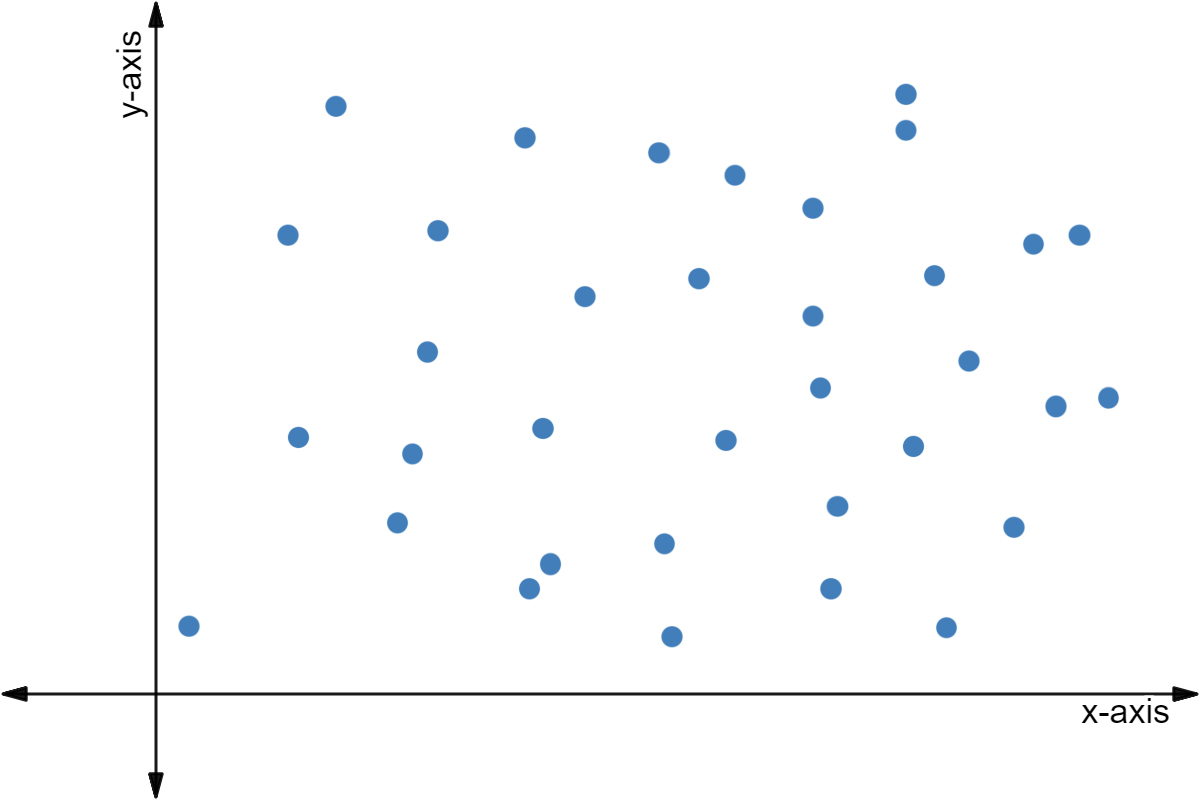
  3. No correlation happens when, as your xx values increase, your yy values show no trend. The number of wild turkeys in Pennsylvania and the hours you spend on your phone probably have no correlation.

Next, he goes over the different questions that could be asked of you on a test. They are:

  1. Determine the relationship between the variables. This can be a positive correlation, a negative correlation, or no correlation.
  2. Plot a point.
  3. Draw a line of best fit.
  4. Estimate a value using your line of best fit.
A scatter plot.

Made using Desmos

Test Yourself: What kind of relationship is represented in the plot above?

Choose one answer

Illustrated · 1 min

What is a Scatter Plot?

Before we begin, here's a quick overview of everything related to scatter plots.

✓Scatter Plots∘\href∘\href∘\href∘\href∘\href\begin{align} &\color{green}{\checkmark}\quad\small{\text{Scatter Plots}}\\ &\circ\quad\small{\href{https://www.expii.com/t/scatter-plot-graph-correlation-4394?type=explanation&id=7667}{\text{Correlation}}}\\ &\circ\quad\small{\href{https://www.expii.com/t/trend-lines-graph-4395?type=explanation&id=7664}{\text{Trend Lines}}}\\ &\circ\quad\small{\href{https://www.expii.com/t/line-of-best-fit-equation-4396?type=explanation&id=7666}{\text{Line of Best Fit}}}\\ &\circ\quad\small{\href{https://www.expii.com/t/line-of-best-fit-equation-4396?type=explanation&id=7668}{\text{Interpolation and Extrapolation}}}\\ &\circ\quad\small{\href{https://www.expii.com/t/correlation-vs-causation-4397?type=explanation&id=7669}{\text{Causation}}}\\ \end{align}

Line break.

A scatter plot is a bunch of points on a graph. Each point represents two sets of data.

For example, you can look at the number of glasses of water someone drinks in a day and the number of times someone goes to the bathroom in a day.

Scatter plot of glasses of water vs. bathroom trips.

Points: (0,1), (1,1), (1,2), (2,4), (2,2), (3,1), (3,5), (4,2), (4,3), (5,5), (5,6), (6,1), (6,8), (7,4), (7,10).

Made using Desmos

Each point on this graph could represent a different person. For example, the point (3,1)(3,1) could refer to Dante who drank 33 glasses of water that day but only needed to use the bathroom once.

Why Use a Scatter Plot?

These plots are very useful for finding a relationship between two sets of data.

In the above example, you can see that on average, as a person drinks more water, they use the bathroom more.

We say on average because it's not always the case. There are other factors that determine whether or not you use the bathroom besides just the amount of water you drink.

Take a look at the points (2,4)(2,4) and (6,1)(6,1). Let's say these represent Charles, who drank 22 glasses of water and needed to use the bathroom 44 times, and Gina, who drank 66 glasses of water and only needed to use the bathroom once.

Notice that just because Gina drank more water than Charles, it doesn't mean she uses the bathroom more. Maybe Charles has a weak bladder, maybe Gina has a stronger bladder. Maybe Charles has a really nice bathroom and likes using it. Maybe Gina used smaller glasses of water than Charles did.

Looking at the points as a collection, though, we do see higher bathroom uses from higher glasses consumed.


Illustrated · 1 min

Correlations

Before we begin, here's a quick overview of everything related to correlations.

∘\href✓Correlation∘\href∘\href∘\href∘\href\begin{align} &\circ\quad\small{\href{https://www.expii.com/t/scatter-plots-4393?type=explanation&id=7653}{\text{Scatter Plots}}}\\ &\color{green}{\checkmark}\quad\small{\text{Correlation}}\\ &\circ\quad\small{\href{https://www.expii.com/t/trend-lines-graph-4395?type=explanation&id=7664}{\text{Trend Lines}}}\\ &\circ\quad\small{\href{https://www.expii.com/t/line-of-best-fit-equation-4396?type=explanation&id=7666}{\text{Line of Best Fit}}}\\ &\circ\quad\small{\href{https://www.expii.com/t/line-of-best-fit-equation-4396?type=explanation&id=7668}{\text{Interpolation and Extrapolation}}}\\ &\circ\quad\small{\href{https://www.expii.com/t/correlation-vs-causation-4397?type=explanation&id=7669}{\text{Causation}}}\\ \end{align}

Line break.

Correlations are connections/relationships between two things.

There are three main types of correlations we can see in scatter plots: positive correlations, negative correlations, and no correlation.

A positive correlation means that as the xx variable increases, so does the yy variable. Our example of glasses of water consumed vs. bathroom trips is a positive correlation. As glasses of water increases, bathroom trips also begins to increase. We can also tell by the upward sloping shape of the data.

A negative correlation means that as the xx variable increases, the yy variable decreases. They will have a downward sloping shape to the data. An example of this might be hours spent studying and problems missed on a test.

Scatter plot of hours studying vs problems missed on a test.

Points: (0,9), (1,0), (1,7), (1.5,5), (2,5), (2,2), (3,4), (3,6), (3.5,2), (4,1), (4,0), (4.5,0), (5,0).

Made using Desmos

On average, those that studied more missed less problems.

Finally, no correlation is when the variables have no connection to each other. An example of this could be the number of times someone searches "rice" on Google, and the number of hats they own.

Googled rice vs. hats owned scatterplot.

Points: (0,3), (0,5), (1,0), (1,8), (2,3), (3,0), (3,2), (3,4), (4,1), (4,7), (5,0), (5,3), (5,5), (6,0), (6,1), (7,5), (7,9)

Made using Desmos

Here, there is no correlation. Googling rice more times doesn't lead to more hats owned or less hats owned.

Correlations can also be perfect, high, or weak.

Perfect positive or perfect negative correlations are when all the points of data fit on the line of best fit.

High positive or high negative correlations are when most of the points of data are clumped close to the line of best fit.

Weak positive or weak negative correlations are when the points of data are scattered but slightly resemble the line of best fit.

Illustrated · 2 min

Scatter Plots

Scatter plots are graphs used to visually represent a correlation between two sets of data, or variables. Our graph will have the independent variable on the xx-axis and the dependent variable on the yy-axis.

Example 1: Positive Correlation

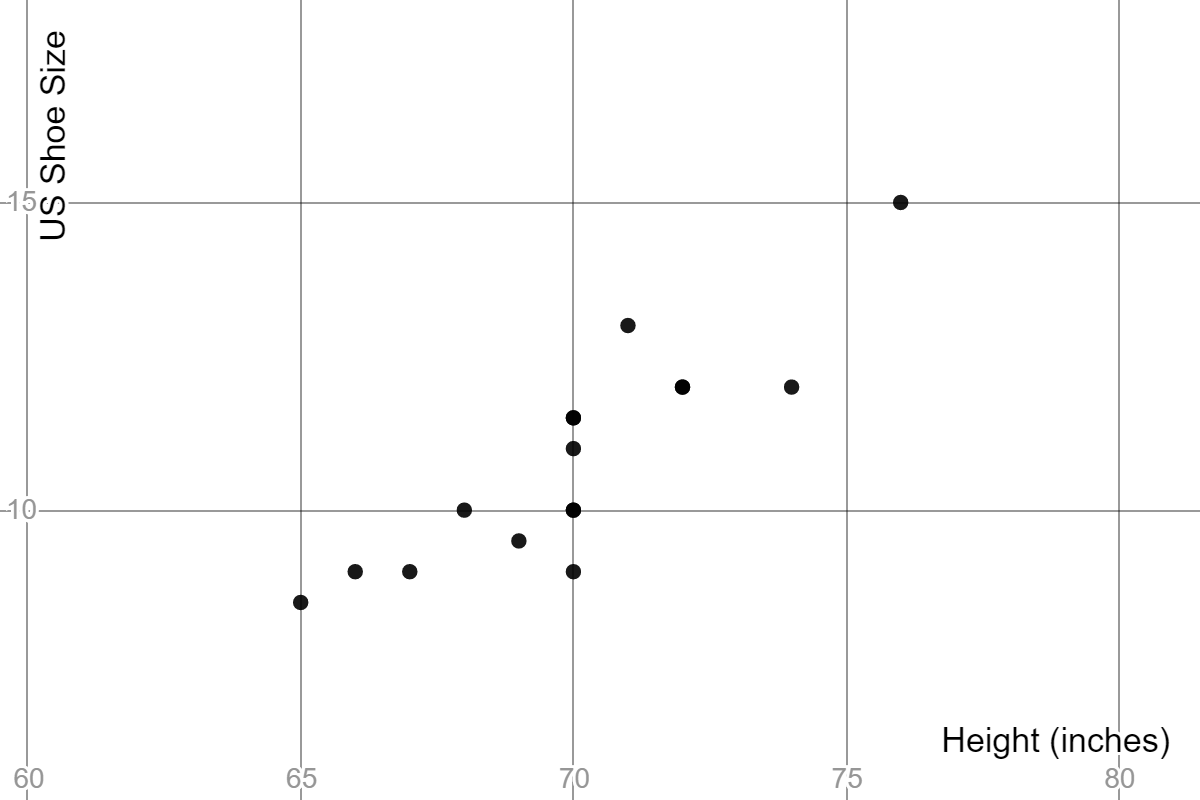
Let's say we want to find the effect of height on shoe size, so we take a survey of all of our male friends to find a correlation between height and shoe size.

Chart of the survey of height and shoe sizes. The top row is all of the heights, and the bottom row is all of the shoe sizes

Chart of our friends' heights and shoe sizes.

We can plot all of these points onto a scatter plot to get a visualization. Height is going to go on the xx-axis as it is our independent variable, and shoe size will be on the yy-axis as it is our dependent variable.

Scatter plot of our friends' height and inches.

We can see here that, in general, our taller friends have a bigger shoe size. This is called a positive correlation. This does not mean that our taller friends will always wear bigger shoes than our shorter ones. We can see this with the data point at 7171 inches. That corresponding shoe size is larger than the points at 7272 and 7474 inches.

Even if we didn't know the exact data behind the points shown on the graph, we can tell that this is a positive correlation because the yy values generally increase as xx goes up.

Example 2: Negative Correlation

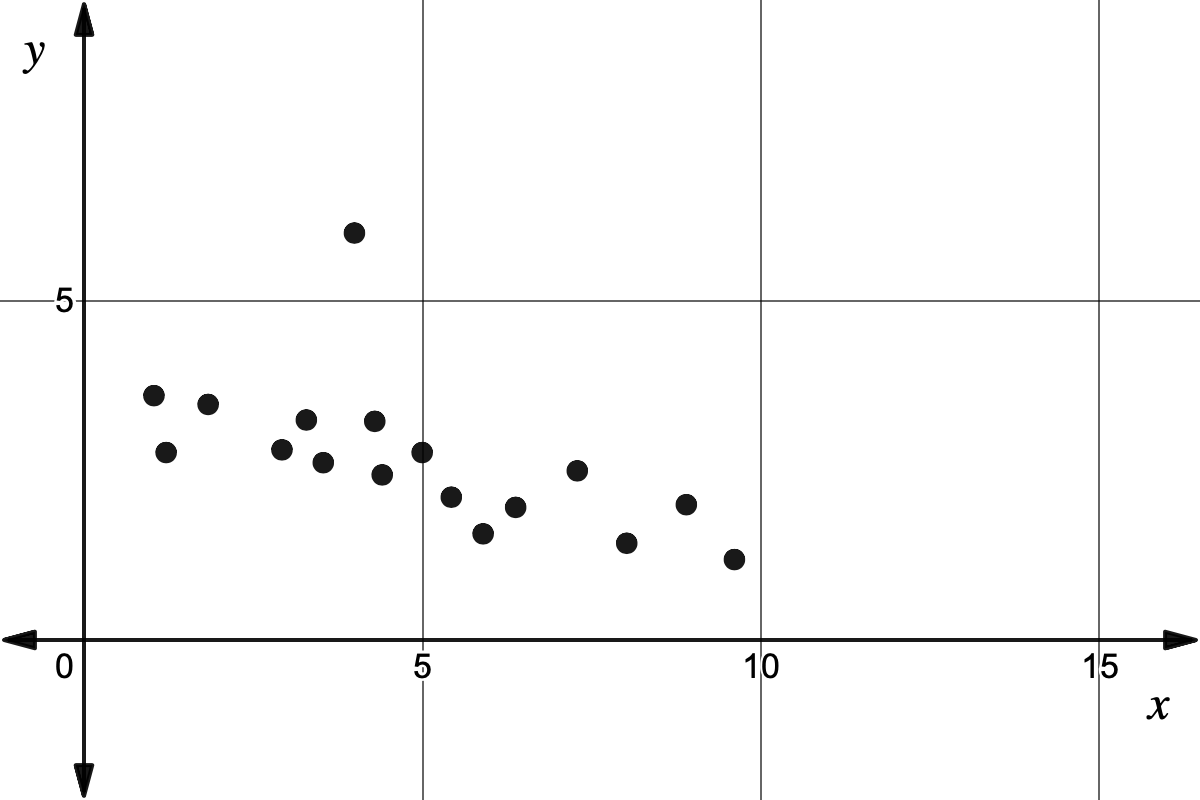
A negative correlation will be the opposite. The yy values will generally decrease as xx goes up.

The graph has a generally downward slope, with some points being out of line with the trend.

The general trend of this scatter plot is downward, even with some points out of place.

Example 3: No Correlation

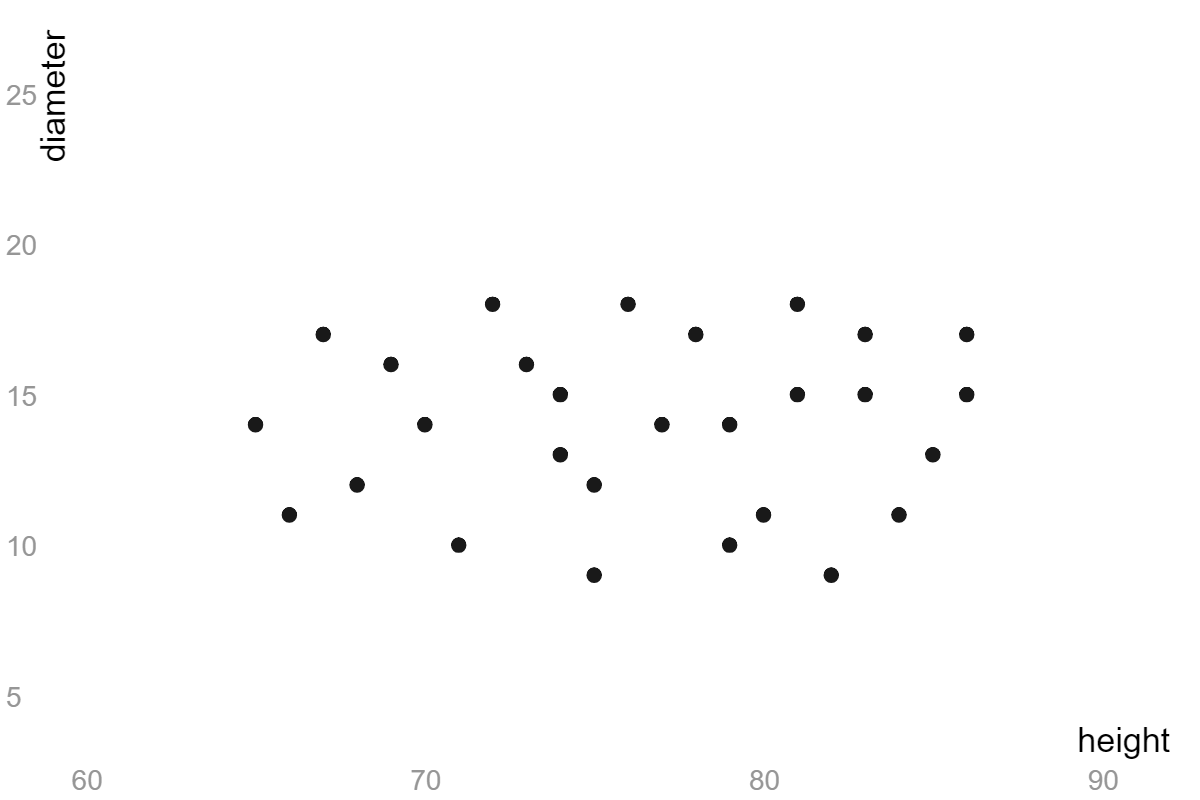
A scatter plot with no correlation means that the xx value has little to no effect on the yy value.

The points are just in a cluster, there is no trend in either direction.

The points in this scatter plot are in a cluster with no real trend up or down.

Correlation vs. Causation

Correlations are general trends shown in data, but trends in our data don't imply causation. Causation is one event that will always lead to another event. For instance, adding an acid to water will always lower the pH.

You can see that our original scatter plot shows a correlation, because a causation would mean that height exactly predicts shoe size. We couldn't have 44 people at 70 in70\text{ in} with different shoe sizes if it was a causation relationship.

Video · + 1 min read

(Video) Scatter Plot and Linear Correlation

by Diane Koenig

Diane Koenig has a video discussing different types of correlation in linear scatter plots.

Summary\large{\text{Summary}}

Positive Correlation

Positive correlated plots have data that rise as you move left to right on the horizontal axis. This tells us that as one of the variables increases, the other variable also increases.

Note: This does not mean that one variable causes the other. It only tells us that there is a relationship or a trend.

A positively correlated scatter plot.

Made using Desmos

Negative Correlation

Negative correlation plots have data that decreases as you move left to right. This tells us that as one of the variables increases, the other variable decreases.

A negatively correlated scatter plot.

Made using Desmos

No Correlation

No correlation plots have data that is all over the place. They have no discernable pattern on horizontal axis or vertical axis.

A scatter plot with no correlation.

Made using Desmos

Perfect, Strong, and Weak

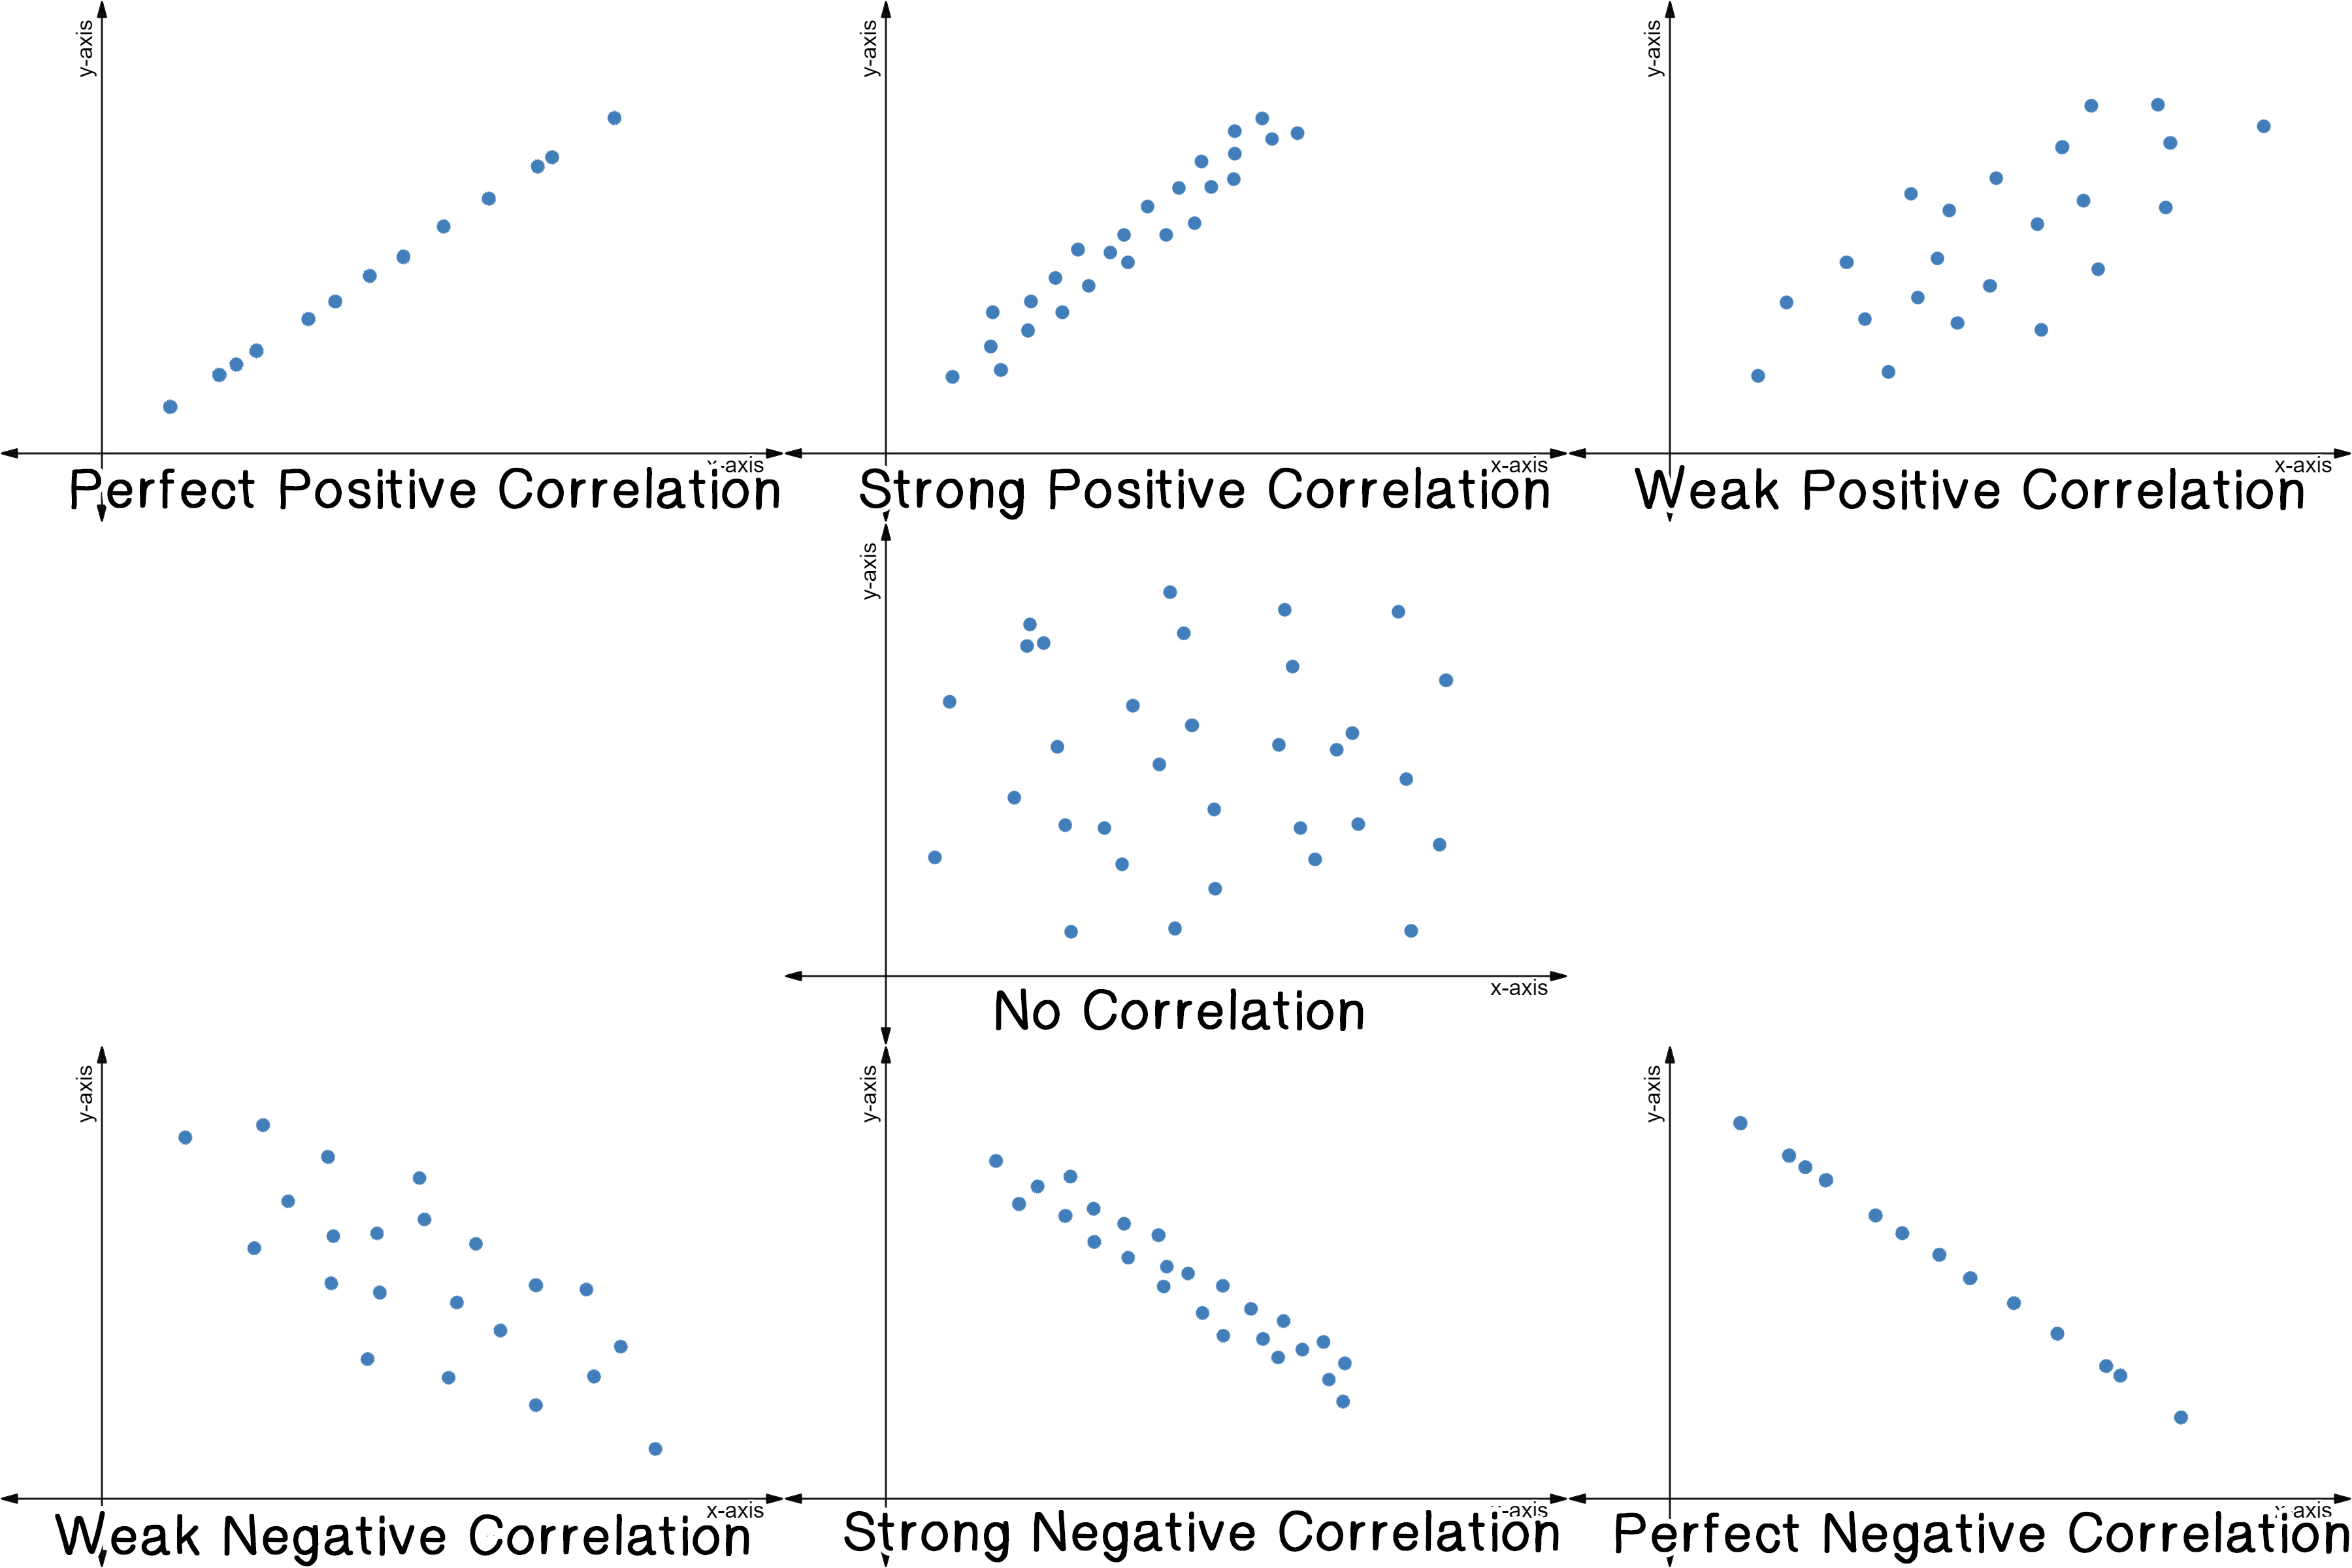
Scatter plots also can have an additional adjective to describe their correlation: perfect, strong, or weak.

  • Perfect correlations fit on an exact (straight) line.
  • Strong correlations fit closely to an exact line.
  • Weak correlations fit loosely to an exact line.
7 scatter plots for perfect positive correlation, strong positive correlation, weak positive correlation, no correlation, weak negative correlation, strong negative correlation, and perfect negative correlation.

Made using Desmos

Video · + 1 min read

(Video) Correlation vs. Causation: How Ice Cream Kills!

by Decision Skills

When it comes to analyzing sets of data, it is important to understand and recognize the difference between correlation and causation. This video from Decision Skills gives a humorous and informative explanation on the differences.

Summary\large{\text{Summary}}

This video by Decision Skills shows that the amount of ice cream sold is positively correlated with obesity, higher crime rates, increase deaths by drowning, and increase forest fires.

This does not mean that buying more ice cream causes more people to get obese, more crimes to happen, more people drowning, and more forests catching on fire.

Correlation is when two things are related, but one does not cause the other. This could be because two things are related to a third factor but they could also just be coincidental.

One reasoning for the correlation between ice cream and forest fires, is weather. People by more ice cream when it's hot out, and more forest fires happen when it's hot out.

Causation is when you can claim one thing causes another to happen.

The pharmaceutical industry is a good example of this. In order for them to claim some medicine has the effect of lowering cholesterol, they have to test the drug. The FDA requires a special process be done.

Type a concept, like “slope” or “photosynthesis”.

↑ ↓ to choose · Enter to openSearch explanations and problems