互反函数:什么是渐近线以及如何求渐近线?

Before this, know绘制互反函数图像

Video · + 1 min read

(Videos) The Reciprocal Function

by mathman1024

Here's a video by mathman1024 explaining the basic rational function, the reciprocal function. The reciprocal function is: f(x)=1xf(x)=\frac1x The t-table for this would look like: xy−2−12−1−1−12−20undf.12211212\begin{array}{r|l} x&y\\ \hline -2&-\frac12\\ -1&-1\\ -\frac12&-2\\ 0&\text{undf.}\\ \frac12&2\\ 1&1\\ 2&\frac12 \end{array} And if we start plotting these points and some others our graph begins taking this shape:
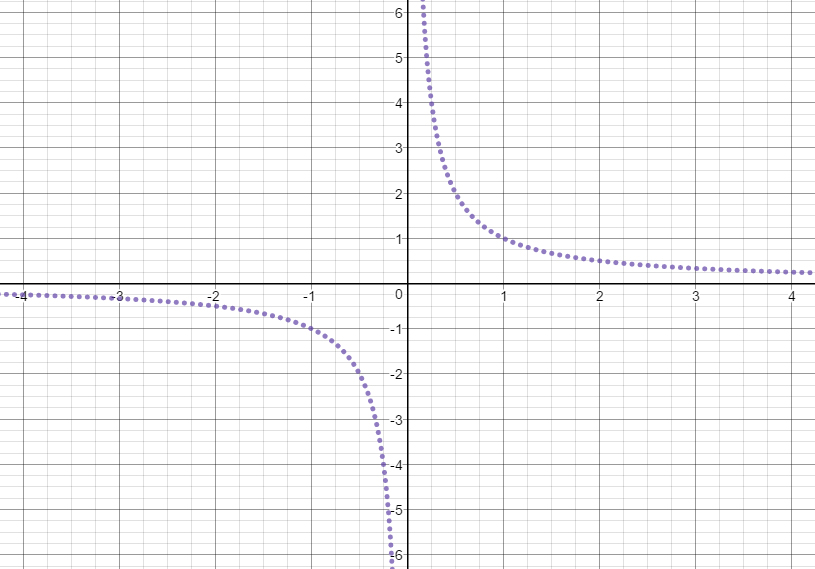
The sketch of the graph

Made using Desmos

If you look at the graph, you’ll notice that it never touches the yy-axis. The graph gets closer and closer to it, but it never actually reaches it.

Because of this, the yy-axis is called a vertical asymptote. A vertical asymptote is a vertical line that the graph approaches but never touches or crosses.

You may also notice that the graph never touches the x−x-axis. This means the xx-axis is a horizontal asymptote.

A horizontal asymptote shows what happens to the graph as xx becomes very large or very small. As you move farther out along the xx-axis (toward positive or negative infinity), the graph gets closer and closer to the horizontal asymptote.

One important difference is that graphs are allowed to cross or touch horizontal asymptotes in some cases. But they will never cross a vertical asymptote.

Understanding asymptotes helps you predict the shape and long-term behavior of a graph.
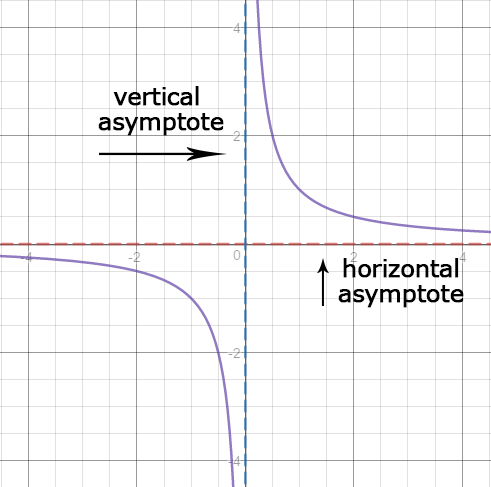
Same graph as before with asymptotes identified

Made using Desmos

Illustrated · 1 min

Asymptotes of Reciprocal Functions

The easiest way to graph reciprocal functions is through the asymptotes. We can figure out the asymptotes of a reciprocal function by looking at its general form,

ax−h+k\frac{a}{x-h} + k

where x=hx=h is the vertical asymptote and y=ky=k is the horizontal asymptote. We also know the general form of a reciprocal function, where it follows this form:

Graph of y=1/x

Made using Desmos

The parent reciprocal function will go through the point (1,1)(1,1) and (−1,−1)(-1,-1).

The function in red is the graph of the parent reciprocal function, y=1xy=\frac{1}{x}. In this case, we know that h=0h=0 and k=0k=0. For the purposes of this lesson, let's draw in our vertical and horizontal asymptotes.

Graph of y=1/x with a purple line of y=0 and a green line of x=0

Made using Desmos

The purple dotted line is the horizontal asymptote at y=0y=0. We know that because in our function, k=0k=0. The green dotted line is the vertical asymptote at x=0x=0. We know that because in our function, h=0h=0.

Let's look at another example of a reciprocal function. Say we were given the reciprocal function, y=1x−3y=\frac{1}{x-3}

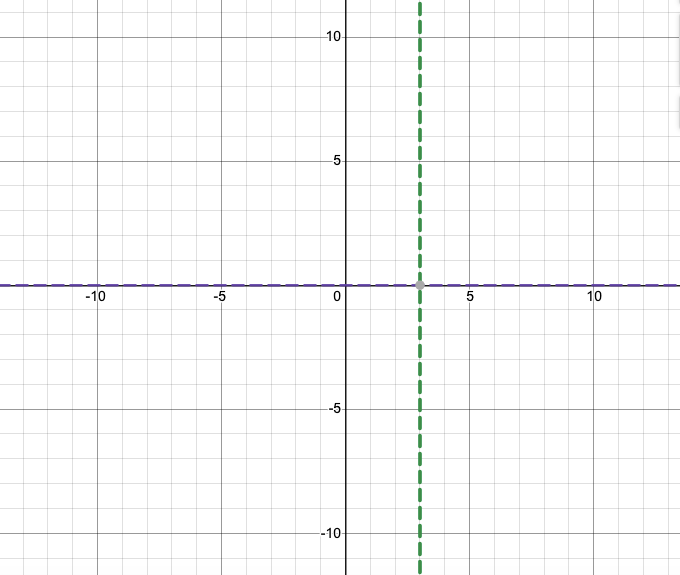
First, we would want to figure out what our asymptotes are. We can see that h=3h=3 and k=0k=0. That means that we will have a vertical asymptote at x=3x=3 and a horizontal asymptote at y=0y=0.

Graph of x=3 and y=0

Made using Desmos

This is a graph of just the asymptotes. From here, we can sketch the general shape of our parent reciprocal function.

Graph of y=1/(x-3), y=0, and x=3

Made using Desmos

Our new function, shifted to the right by 33 units, will go through the points (4,1)(4,1) and (2,−1)(2,-1).

Illustrated · 1 min

Reciprocal Functions: Asymptotes

When graphing reciprocal functions, asymptotes are very helpful.

Asymptotes are invisible lines that a graph gets closer and closer to, but never actually touches.

These lines help us understand what happens to the function when xx becomes very large, very small, or gets close to certain values.

By looking at the asymptotes, we can better predict the shape and behavior of the graph. Rational functions may also have restrictions in their domain and range.

Reciprocal Functions: Asymptotes
For a reciprocal function, a/(x-h) +k
Horizontal asymptote: y=k
Vertical asymptote: x=h

Image source: by Anusha Rahman

The vertical asymptote can be found at x=hx=h, and the horizontal asymptote y=ky=k.

A vertical asymptote is where the denominator of the function is zero - so the function is undefined. For example, in f(x)=1x−2f(x) = \frac{1}{x-2}, the vertical asymptote is x=2x=2. As xx approaches 22, the values of f(x)f(x) increase to infinity or reduce to negative infinity.

A horizontal asymptote shows the end behavior of the function as xx goes to infinity or negative infinity. For example, in a basic reciprocal function like f(x)=1xf(x)=\frac{1}{x}, the horizontal asymptote is y=0y=0. That means that as xx gets big or small, the output of the function gets closer and closer to zero.

Let's say that the function shifts, such as with f(x)=1x−3+4f(x)=\frac{1}{x-3} + 4. The horizontal asymptote is y=4y=4 and the vertical asymptote is x=3x=3. These shifts can help us to quickly identify the asymptotes just by looking at the equation. Understanding asymptotes allows us to sketch the graph accurately and predict its behavior near undefined or extreme values.

Type a concept, like “slope” or “photosynthesis”.

↑ ↓ to choose · Enter to openSearch explanations and problems