
Interactive · 1 question

+1 contributors

There are different methods to solving systems of equations. You've already learned about graphing systems of linear equations, but now we're going to dive into graphing systems of nonlinear equations.
This is just one method of solving systems of nonlinear equations! You can also use elimination and substitution.
Before we begin, let's establish a definition for what a non-linear system of equations is.
A non-linear system of equations is a system of two or more equations, where at least one equation is non-linear.
Non-linear equations are equations where the power is not equal to , such as quadratic functions (), cubic functions (), and square root functions ().
Graphing Systems of Nonlinear Equations
The rules for graphing systems of linear and nonlinear equations are very similar. The point of intersection for two graphed equations is the solution to the system of equations. This definition is the same as we saw with linear systems of equations. The main difference, however, is there can be multiple points of intersection with non-linear systems of equations!
Imagine a quadratic function (U-shaped) and a linear function (a line). If the two functions were to meet (at a point that's not the vertex), the linear function would intersect the quadratic function twice.
To review, check out our lesson on how to graph functions.
Look at the following graph:

Made using Desmos
The blue function represents . The red function represents .
As we can see from the graph, these two functions intersect at two points, and . These two points of intersection represent the solution to the system of equations.
So, the system of non-linear equations,
...has a solution of and .
When we are evaluation a system of non-linear equations, we may not always have two solutions. In the previous example, we had two solutions because the linear equation crossed the quadratic equation.
In this next example, let's consider what happens when we have a system of non-linear equations, a linear function and a cubic function.

Made using Desmos
The blue linear function is and the red cubic function is . The two functions meet at three points, , , and . We know that the solution to a non-linear system of equations is the points where the two functions meet.
That means that , , and are the solutions to the following system of equations:
There are times when a system of non-linear equations may not have a solution! This would mean that the two graphed equations do not meet at all. Here is an example:

Made using Desmos
Try an example on your own!
Example
Use the graphing method to find the solution(s) to the following system of non-linear equations:
Solution
If we were to graph the two equations, we would see the following graph:
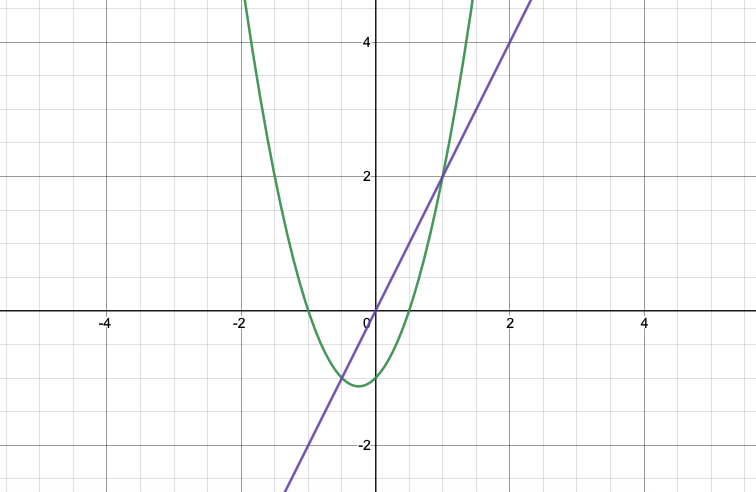
Made using Desmos
We know that the solution to a system of non-linear equations is when the two functions intersect. In this case, the two points of intersection are: and .


