Video · + 2 min read

(Video) Chi-squared Test

by Bozeman Science
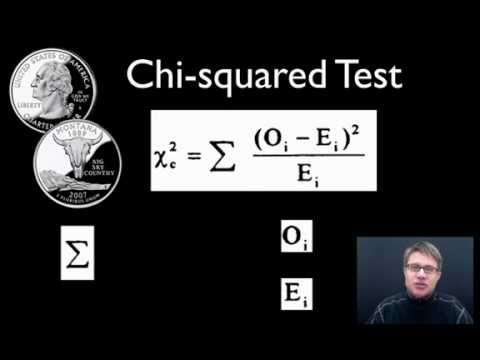
Check out this video by Bozeman Science on how to conduct a chi-squared test!

Chi-squared tests are very useful to determine if there are differences between observed and expected values. They are particularly very useful in biology.

You have previously seen the equation for the chi-squared test, but that can be very daunting, so we will summarize the step-by-step process in the video.

Like Mr. Andersen says, the goal of a chi-squared test is to accept or reject the null hypothesis, which is when there is no statistical difference between the observed and accepted values.

First, we need to define two vocabulary terms:

Degrees of freedom: number of outcomes (sample size) - 1

Critical value: Using a level of significance, often 0.05, with the degrees of freedom, we can use the critical values table to find the critical value. After calculating the chi-squared value, if your value is greater than the critical value, then you reject the null hypothesis. In other words, there is a significant difference. If your value is less than the critical value, then you accept the null hypothesis.

Let's break down the steps Mr. Anderson uses in his example!

Mr. Anderson rolls 36 dice.

There are 6 options: 1, 2, 3, 4, 5, 6

Our expected values are 6 for each dice option.

Our observed values are: 2, 4, 8, 9, 3, 10.

The math to find the chi-squared value worked out is:

(o−e)2e+(o−e)2e+(o−e)2e+(o−e)2e+(o−e)2e+(o−e)2e\frac{(o-e)^2}{e} +\frac{(o-e)^2}{e}+\frac{(o-e)^2}{e}+\frac{(o-e)^2}{e}+\frac{(o-e)^2}{e}+\frac{(o-e)^2}{e} =(2−6)26+(4−6)26+(8−6)26+(9−6)26+(3−6)26+(10−6)26=\frac{(2-6)^2}{6} + \frac{(4-6)^2}{6}+ \frac{(8-6)^2}{6}+ \frac{(9-6)^2}{6} + \frac{(3-6)^2}{6}+ \frac{(10-6)^2}{6} =166+46+46+96+96+166=\frac{16}{6} + \frac{4}{6} + \frac{4}{6} + \frac{9}{6} + \frac{9}{6} + \frac{16}{6} =586=9.6=\frac{58}{6} = 9.6

Therefore, the chi-squared value is 9.6.

Now, we have to find our critical value.

We have 6 different outcomes, so our degrees of freedom is 5. We are using a significance level of 0.05, so using the table of critical values, our critical value is 11.070.

Our chi-squared value of 9.6 is less than the critical value of 11.070, so we can accept the null hypothesis that there is no statistically significant difference between our observed and expected values.

Learn about the chi-squared distribution to learn even more about chi-square!

Read · 3 min

In this lesson, you will learn about the chi-square test, a cool statistical tool we use to check if there's a significant relationship between two categorical variables. So far, we've primarily learned about statistical tests for quantitative variables, so this new test will expand your reach for what you can do with statistics! We will break this concept down step-by-step, starting with the basics.

The Chi-Square Test

The chi-square test helps us to see if the differences between observed frequencies (what we actually see) and expected frequencies (what we'd expect to see if there was no effect) are due to chance or if something else is going on.

Before diving in, let's review some key terms.

  • Hypothesis testing is a method to decide if there's enough evidence to support a claim about a population.
  • Categorical variables are variables that can be divided into different categories (i.e., colors, types of animals, sports teams)
  • Observed frequencies are how often you actually see something in your data
  • Expected frequencies are how often you would expect to see something if the variables were independent
  • Contingency table is a table that displays the frequency distribution of variables. It shows the rows and columns of your data
  • Test statistic is a number calculated from your data to see if the observed frequencies differ significantly from the expected frequencies

The distribution of the chi-square test statistic is called a chi-square distribution, which helps us determine if our results are statistically significant.

Constructing the Chi-Square Test

First, create a contingency table This table will have rows and columns showing the different categories of your variables. For example, if you're comparing favorite fruits by gender, you might have rows for each gender and columns for each fruit.

Second, state your hypotheses Remember the null and alternative hypotheses!

  • The null hypothesis (H0H_0) assumes that the variables are independent (no relationship between them). For example, "H0H_0: gender and favorite fruit are independent".
  • The alternative hypothesis (HaH_a) assumes that the variables are not independent (there is a relationship).

Third, calculate expected frequencies We can use the follow formula, which will tell us what we would expect if there was no relationship between the variables.

Expected Frequency=Row Total⋅Column TotalGrand Total\text{Expected Frequency} = \frac{\text{Row Total} \cdot \text{Column Total}}{\text{Grand Total}}

Fourth, compute the chi-square test statistic This formula sums up the differences between the observed and expected frequencies, squared, and then divided by the expected frequences.

χ=Σ(Observed Frequency−Expected Frequency)2Expected Frequency\chi = \Sigma\frac{(\text{Observed Frequency} - \text{Expected Frequency})^2}{\text{Expected Frequency}}

Fifth, determine the degrees of freedom

Degrees of Freedom=(Number of Rows−1)⋅(Number of Columns−1)\text{Degrees of Freedom} = (\text{Number of Rows} -1) \cdot (\text{Number of Columns} - 1)

Sixth, compare with a chi-square distribution Use a chi-square distribution table to find the p-value. This value tells us if the test statistic is large enough to reject the null hypothesis.

Seventh, decide if the results are statistically significant

  • If the p-value is less than your significance level (usually α=0.05\alpha=0.05), then you reject the null hypothesis. This means that there is a significant relationship between the variables.
  • If the p-value is greater than your significance level, then you do not reject the null hypothesis. This means that there isn't enough evidence to say the variables are related.

Type a concept, like “slope” or “photosynthesis”.

↑ ↓ to choose · Enter to openSearch explanations and problems
