Interactive · 10 questions
+4 contributors




Remember that the general form for a quadratic expression is:
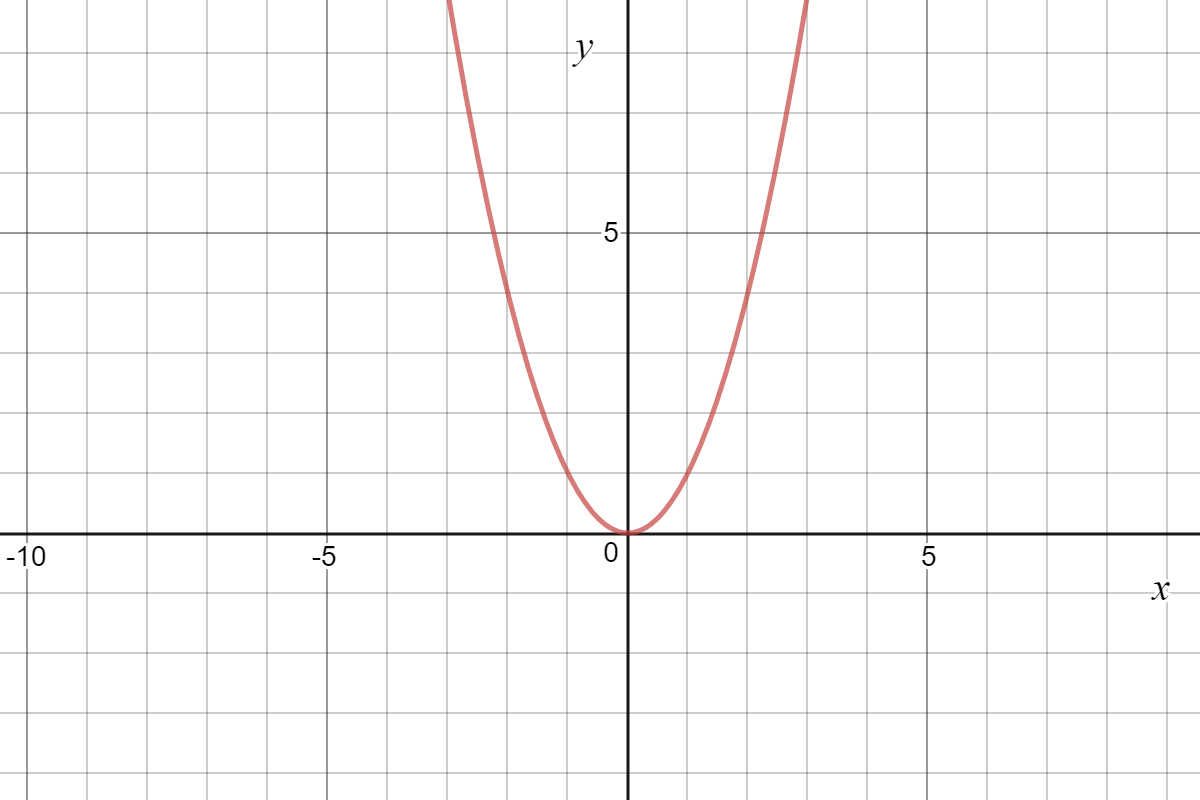
Let's take a look at the graph of this quadratic equation when and . This graph is of the function :
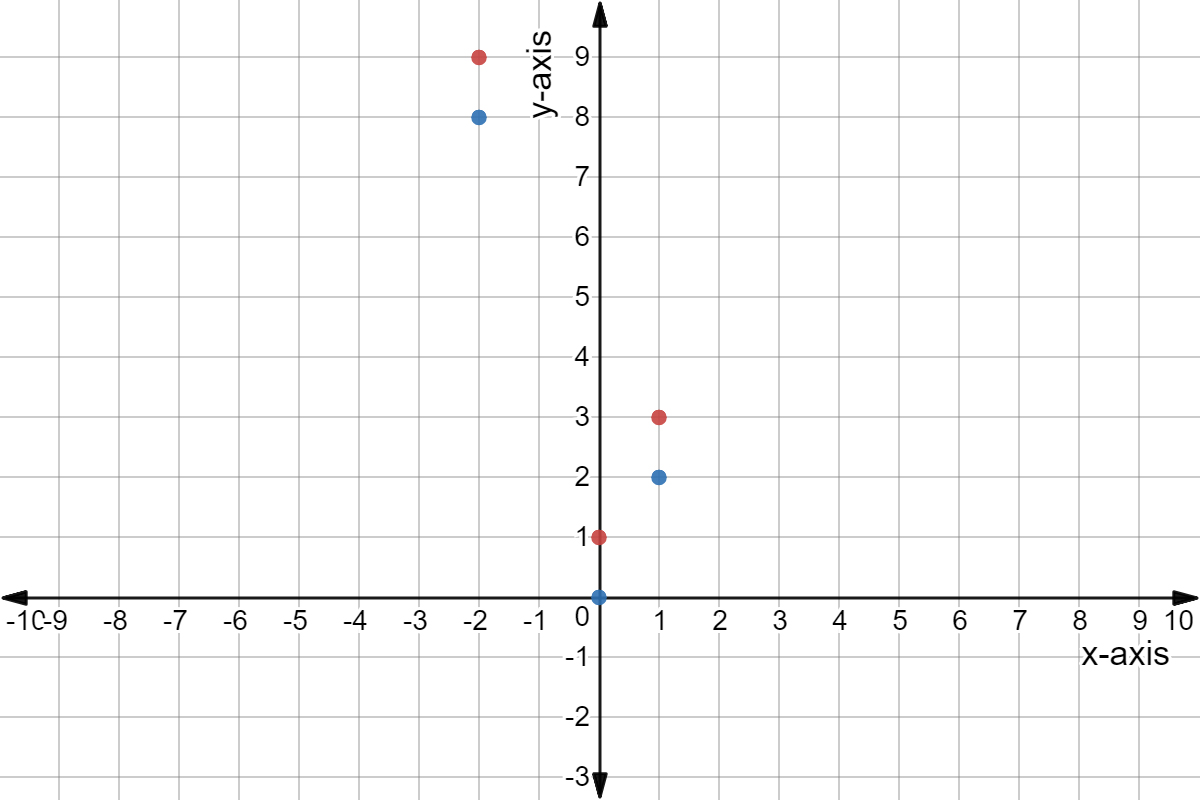
Now, what do you think happens when ? Let's check out a few scenarios to see if we can identify a pattern.
Consider the quadratic expression
What is the value of coefficient ""?
Consider the quadratic expression
What is the value of constant ""?
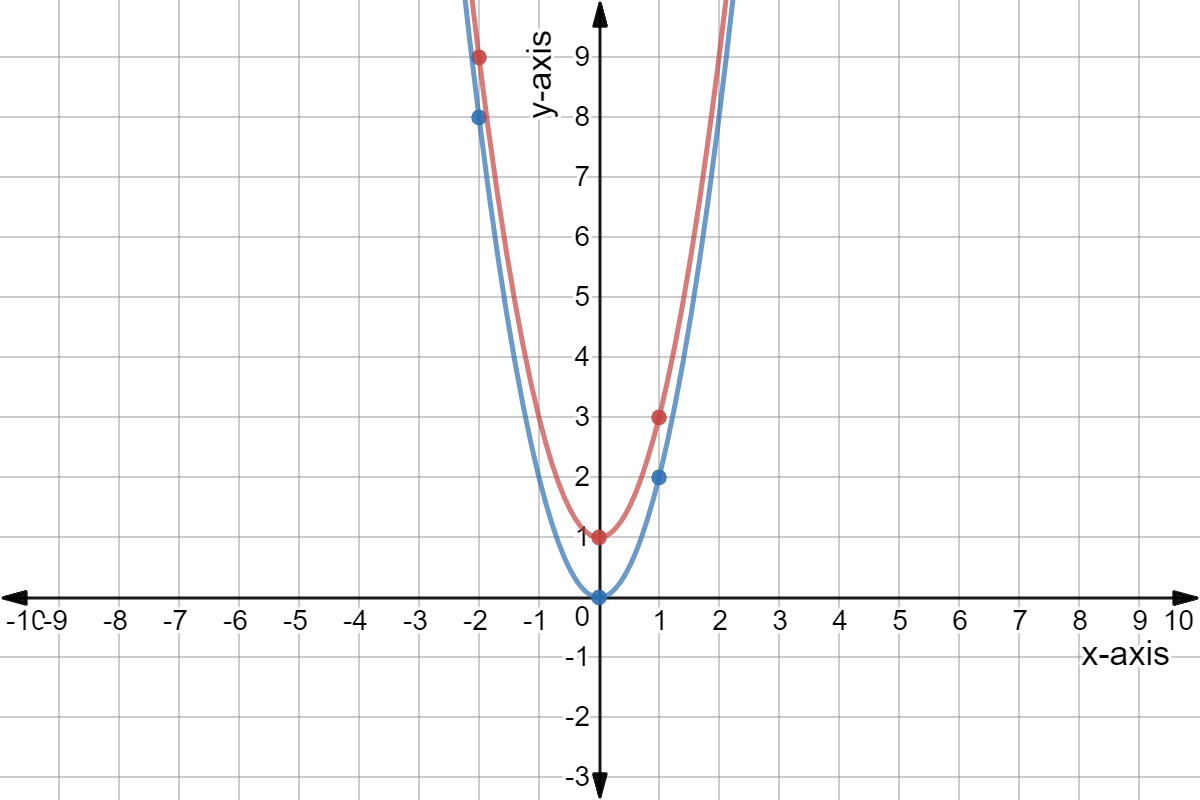
Here is the graph for that quadratic expression, :
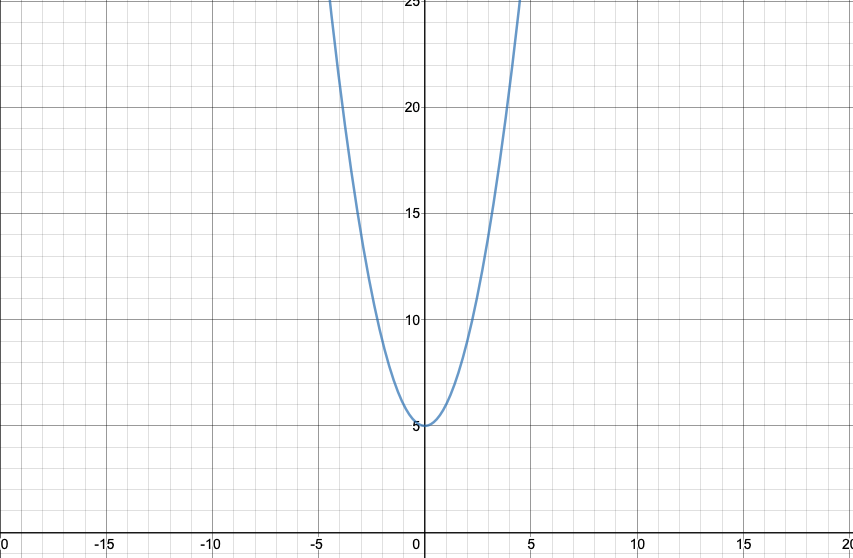
The graph above is what we get when and . Notice how the vertex is at .
The graph below is what we get when and . Notice how the vertex is at . This is the graph of .
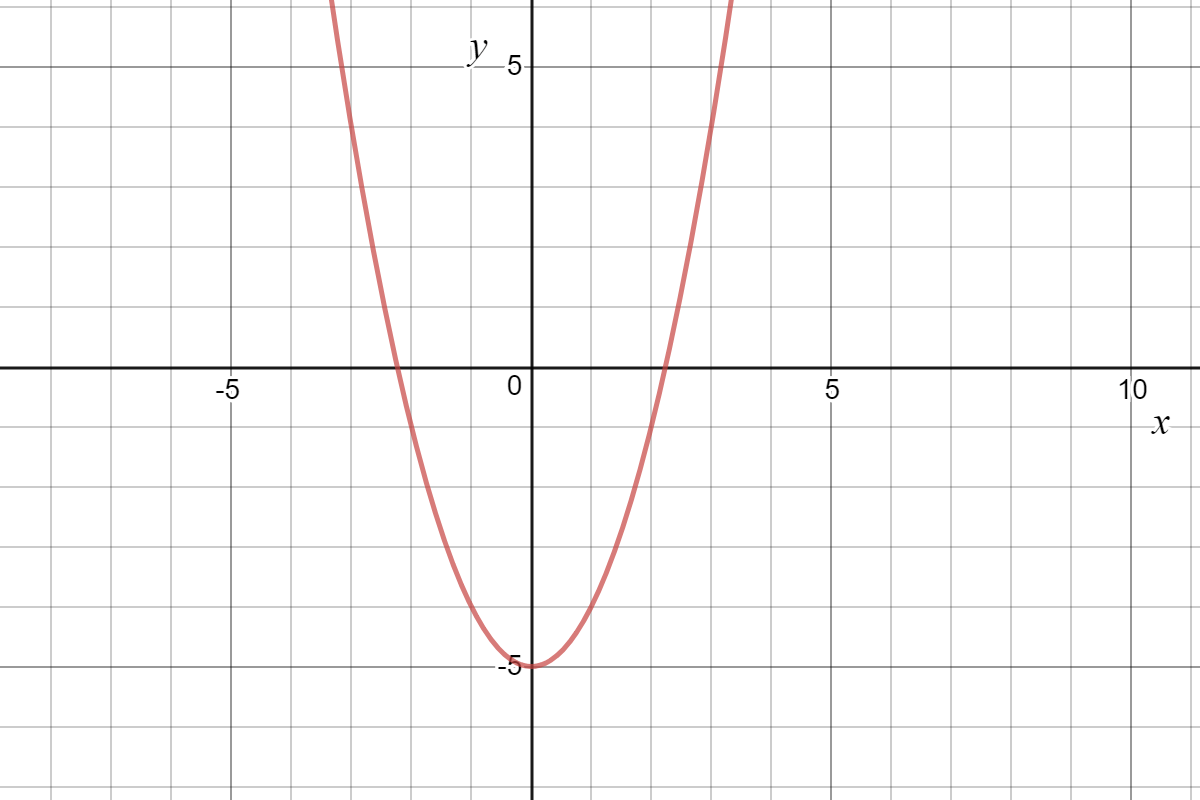
So, we can say that the -value of the vertex is determined by the value of .
Consider the quadratic expression
What is the value of coefficient ""?
What is the value of constant ""?
Where on the graph of this quadratic expression will we find the opening of the parabola?
Let's leave , but now say that . What happens now? Does the value of still determine the -value of the vertex??
Let's check it out! Here is a graph of .
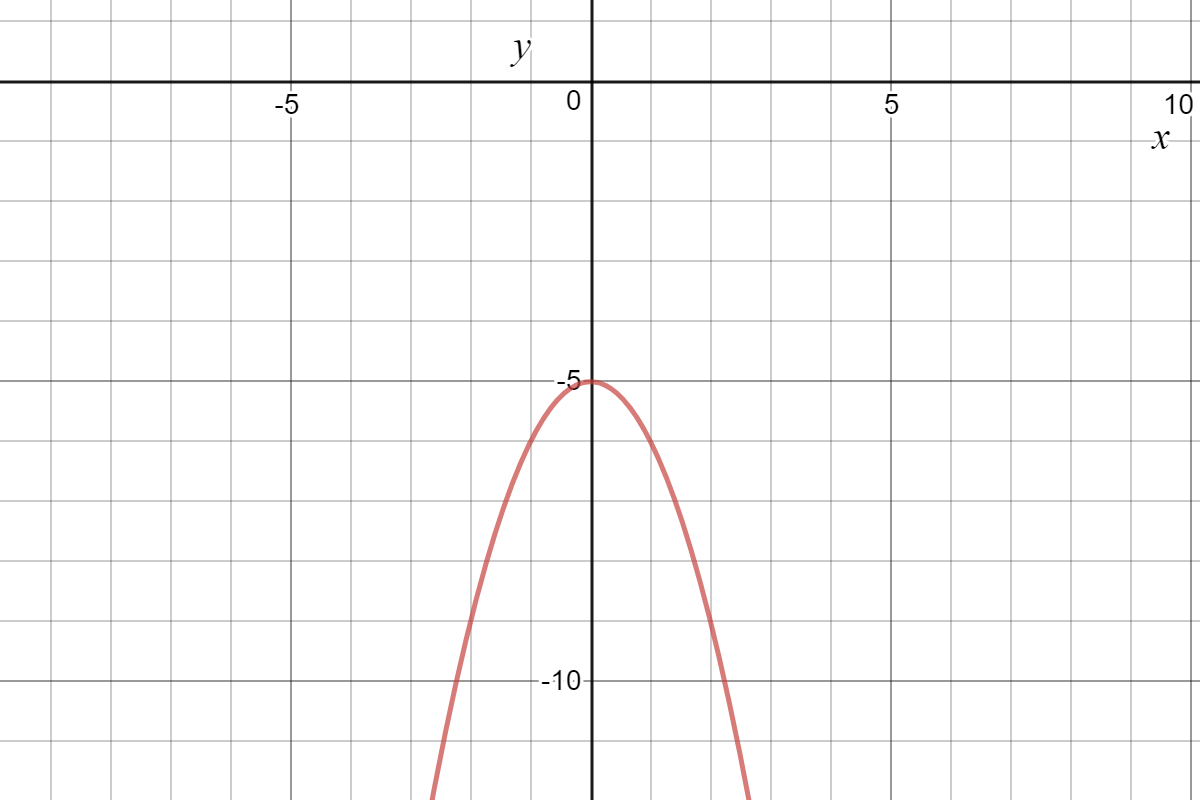
Yup, the value of still determines the -value of the vertex. It still opens at because .
Note that the direction of the parabola (whether it opens upwards or downwards) is determined by whether or not coefficient "" is positive or negative.
Consider this quadratic expression:
What is the value of coefficient ""?
What is the value of constant ""?
Where on the graph of this quadratic expression will we find the vertex of the parabola?
Will the parabola open upwards or downwards?
The coefficient in front of the term is positive , so the parabola will open upwards. This means the parabola will have a vertex of and open upwards.
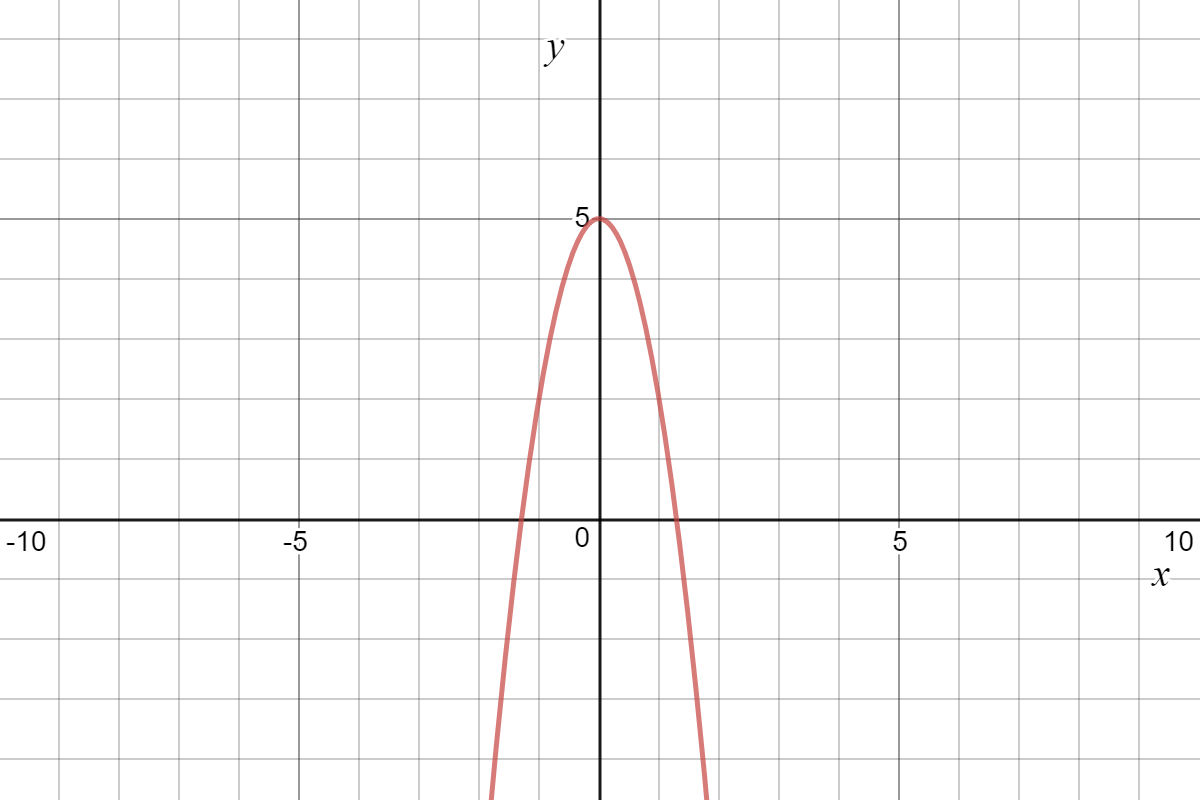
Let's look at a graph and try to find the equation.
Made using Desmos
Consider the graph above. Which of the following quadratic expressions was most likely used to create it?
The correct answer here must be Choice . What we know, just looking at the graph is:
- The parabola opens downwards. This means that the coefficient "" must be negative.
- The parabola opens at . This means that the quadratic equation will end in .
The only choice that fits these criteria is choice : .