Read · 2 min
+2 contributors


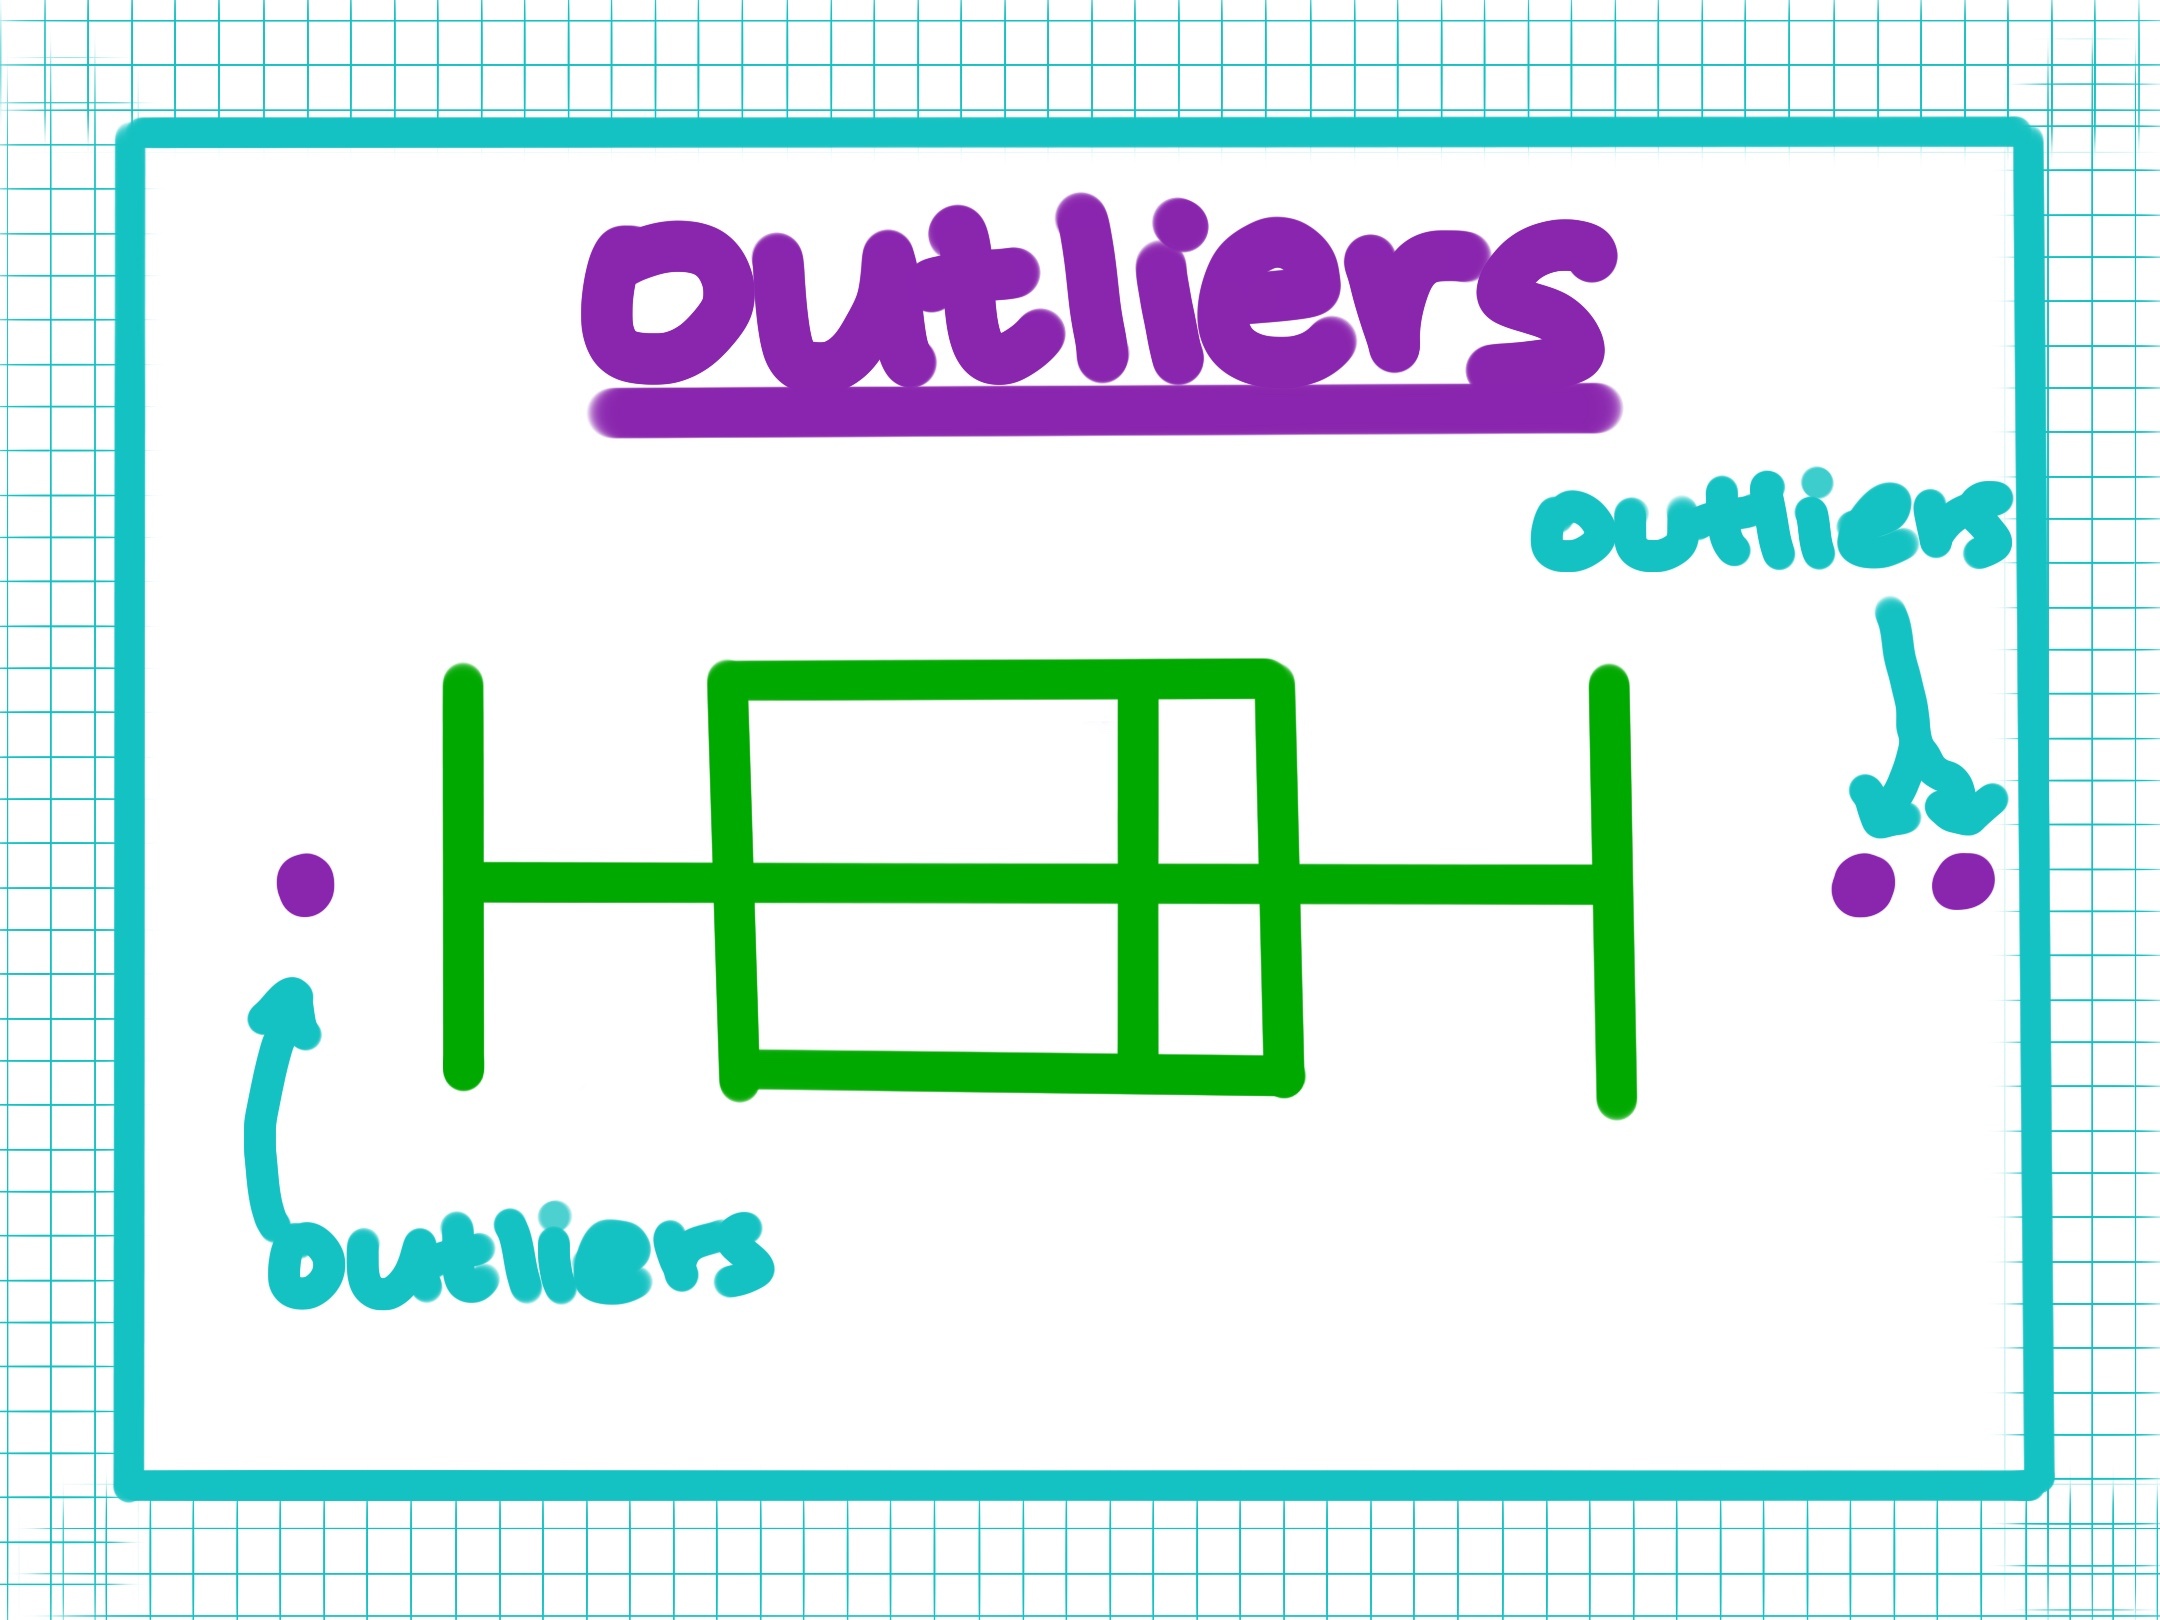
So far in statistics, we have learned about the range, the interquartile range (IQR), and how we can use both of these to compare data with the box and whisker plot. However, the interquartile range also has other uses: it can help us find outliers!
##Outliers
Outliers are data points in a data set that are too high or low compared to the rest of the dataset. When conducting an experiment, outliers are often a result of experimental error. If an extreme data point can be proven to be an outlier, then researchers will often exclude the data point from their analysis. But, we need to prove whether a suspicious data point is truly an outlier!
##Determining Outliers
Lucky us! There are a few very handy formulas we can use to find out if a datapoint is an outlier:
Lower quartile .
Any data point below this value is an outlier
Upper quartile .
Any data point above this value is an outlier
##Let's work through an example!
We have a dataset of numbers:
Just looking at these numbers, there are a few that stand out as being too extremely large or small: and . However, we cannot just say these are outliers, we have to prove it. Let's use the formulas.
First, we have to calculate the interquartile range. Remember, the IQR is the difference between the upper (third) quartile and the lower (first) quartile (Q1 and Q3).
To find the upper quartile (Q3), we have to find the median of the upper half of the dataset. To find the lower quartile (Q1), we have to find the median of the lower half of the dataset.
Hint! It helps to reorder the dataset in numerical order:
Dataset:
In this dataset, the upper quartile is . The lower quartile is .
Therefore, the IQR .
Now let's use the first formula to find the lower limit for any outliers.
Remember, the formula is: lower quartile .
Since is greater than , we know that 1 is not an outlier. This is a great example of why we need the outlier test because even though seems much smaller than the other numbers, it's not actually an outlier.
Let's try the second formula to find the upper limit for any outliers. Remember, the formula is: Upper quartile .
Because is greater than , we know that is an outlier.