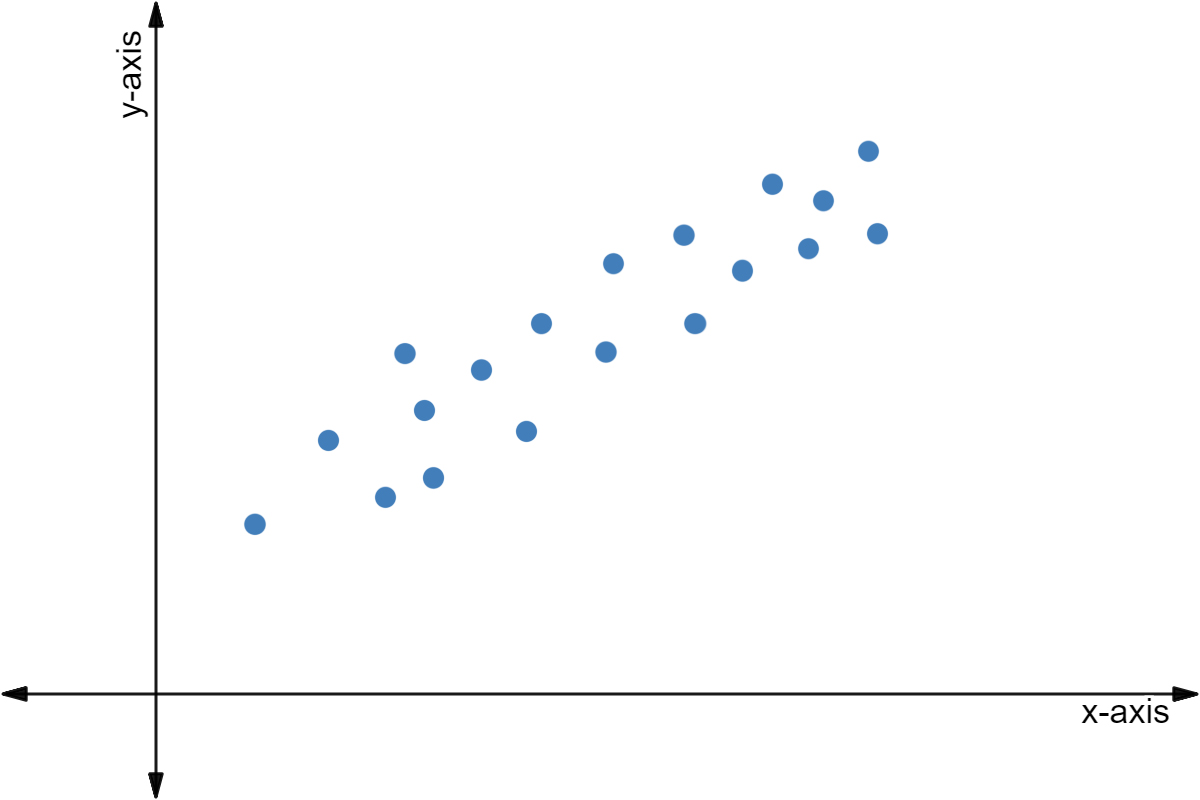
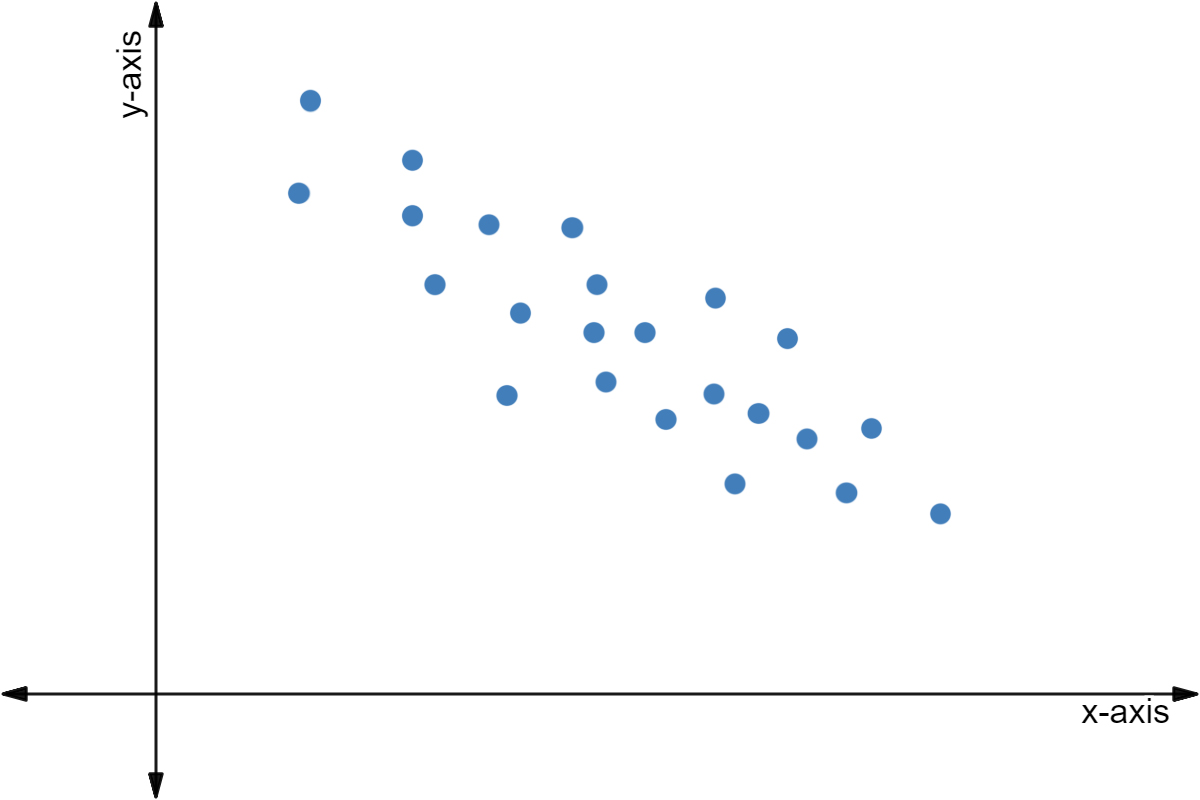
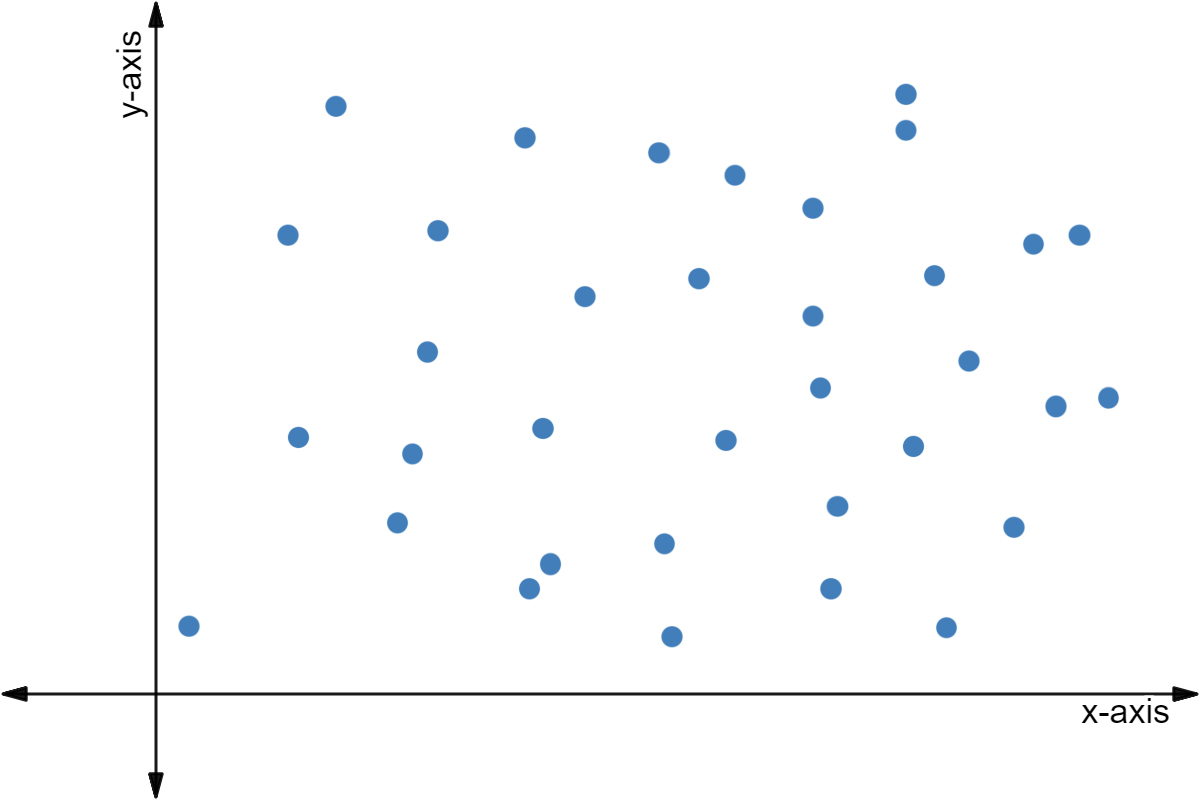
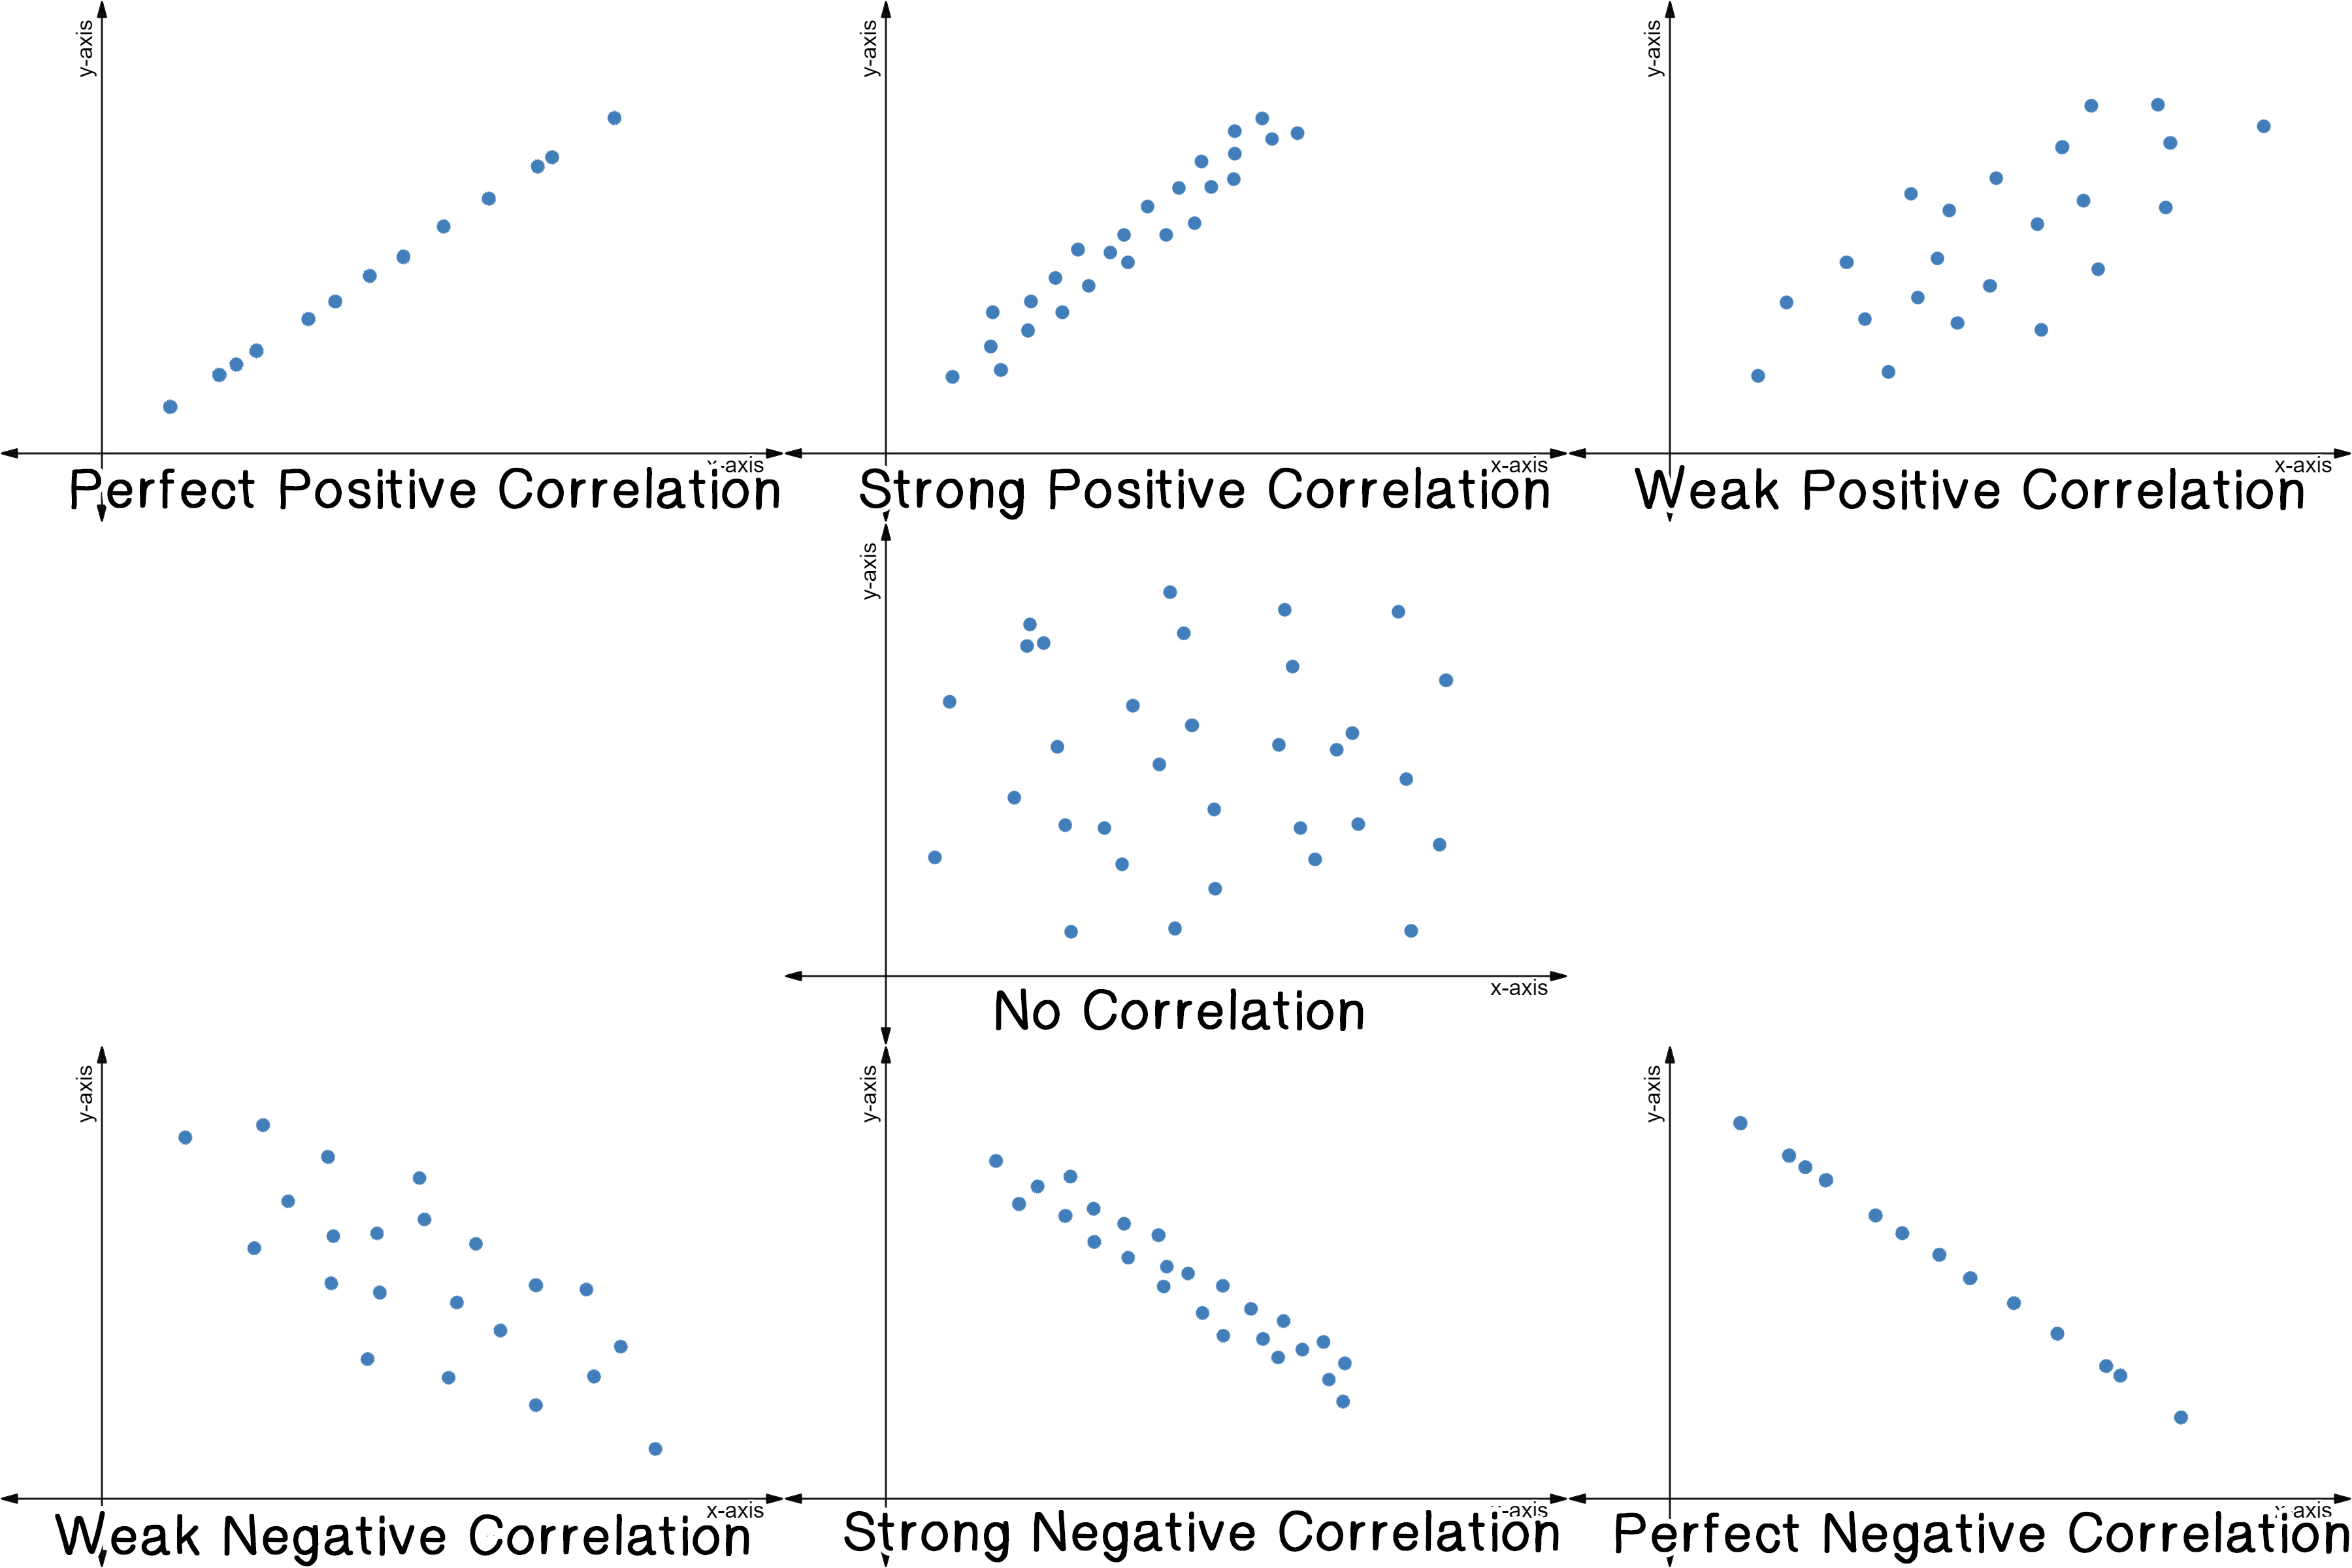
What is a Scatter Plot?
Before we begin, here's a quick overview of everything related to scatter plots.
✓Scatter Plots∘\href∘\href∘\href∘\href∘\href
A scatter plot is a bunch of points on a graph. Each point represents two sets of data.
For example, you can look at the number of glasses of water someone drinks in a day and the number of times someone goes to the bathroom in a day.
Each point on this graph could represent a different person. For example, the point (3,1) could refer to Dante who drank 3 glasses of water that day but only needed to use the bathroom once.
Why Use a Scatter Plot?
These plots are very useful for finding a relationship between two sets of data.
In the above example, you can see that on average, as a person drinks more water, they use the bathroom more.
We say on average because it's not always the case. There are other factors that determine whether or not you use the bathroom besides just the amount of water you drink.
Take a look at the points (2,4) and (6,1). Let's say these represent Charles, who drank 2 glasses of water and needed to use the bathroom 4 times, and Gina, who drank 6 glasses of water and only needed to use the bathroom once.
Notice that just because Gina drank more water than Charles, it doesn't mean she uses the bathroom more. Maybe Charles has a weak bladder, maybe Gina has a stronger bladder. Maybe Charles has a really nice bathroom and likes using it. Maybe Gina used smaller glasses of water than Charles did.
Looking at the points as a collection, though, we do see higher bathroom uses from higher glasses consumed.