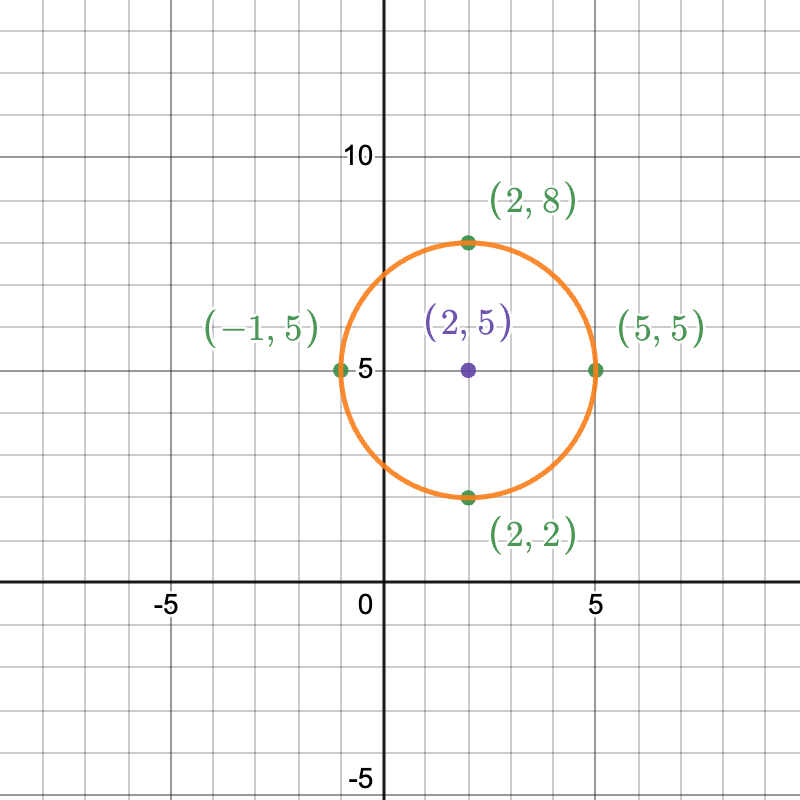
使用圆心和半径绘制圆的图像

Before this, know求圆的圆心和半径

Video

(Video) Graph a Circle

by mathman1024

Here's a video by mathman1024 showing you how to graph a circle using the center and radius. Remember that the center-radius form for a circle is: (x−h)2+(y−k)2=r2(x-h)^2+(y-k)^2=r^2 Where the center is the point (h,k)(h,k) and the radius is rr.

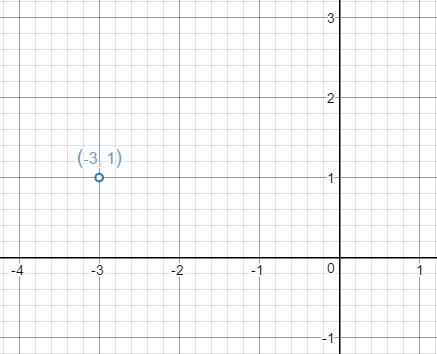
The example he looks at is: (x+3)2+(y−1)2=814(x+3)^2+(y-1)^2=\frac{81}4. We know the center is the opposite signs of the numbers in the equation, so: (−3,1)(-3,1). So let's plot this point!

Created via Desmos

Now we know the radius is the square root of the number on the end. So: r=814=92r=\sqrt{\frac{81}4}=\frac92. So now we plot a point that's 92\frac92 units away from the center in each direction: north, south, east, and west.
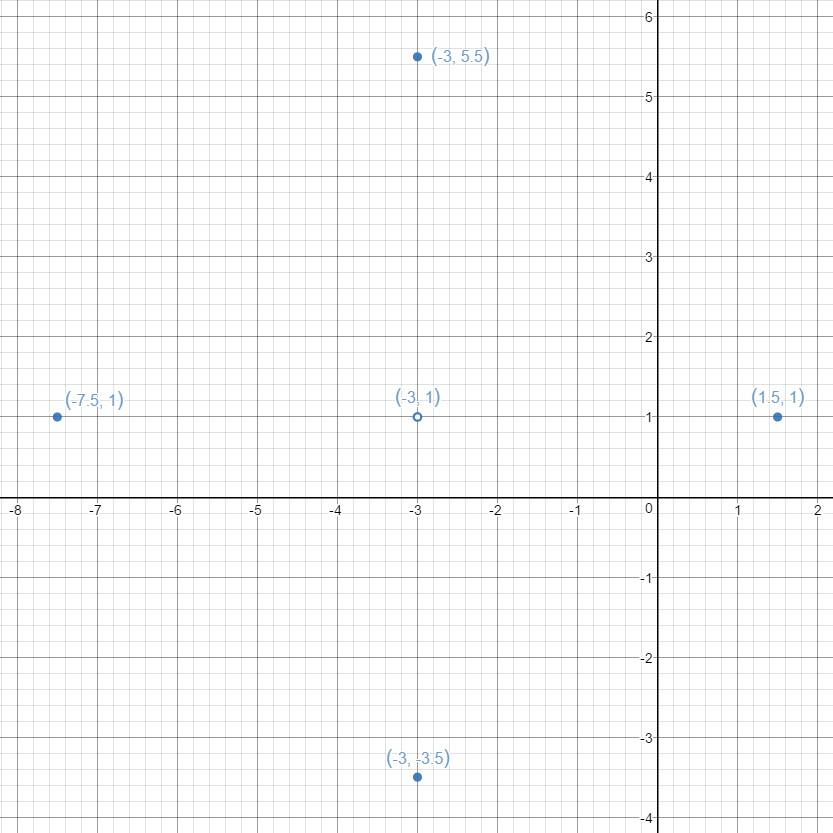
Created via Desmos

Now that we have the outline we just need to make a circle around these outer points!

Created via Desmos

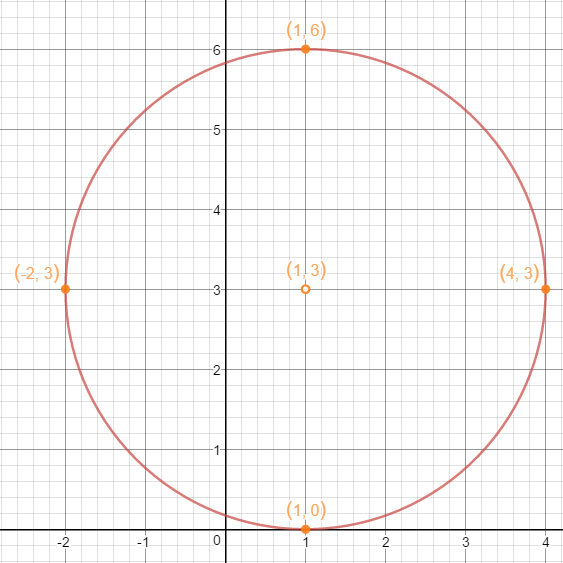
Test Yourself: Graph the circle (x−1)2+(y−3)2=9(x-1)^2+(y-3)^2=9.

Created via Desmos

Illustrated · 1 min

Graphing a Circle

To graph a circle, there are only two things you need. We can find both of these things from the equation of a circle in standard form. You know how to complete the square to convert forms.

Graphing a Circle
(x-h)^2 + (y-k)^2 = r^2
(h,k): the circle's center
r: the circle's radius

Image source: by Anusha Rahman

The point (h,k)(h,k) tells you the coordinates of the center of the circle. The rr value gives you the radius of the circle. Using this information from the equation of a circle, you can easily graph a circle!

You may remember that in a previous lesson, you learned about completing the square to convert the standard form of a circle equation to the general form.

Illustrated · 1 min

Graphing a Circle with the Center and Radius

In the previous lesson, you learned how to find the center and radius of a circle, using either the standard form equation or graphing. In this lesson, we will use those skills to graph a circle, knowing the center and radius.

Before we begin, let's quickly review the standard form of a circle equation. That can tell us the coordinates for the center of the circle and the length of the radius.

Let's walk through an example to make this concept easier to digest.

Example

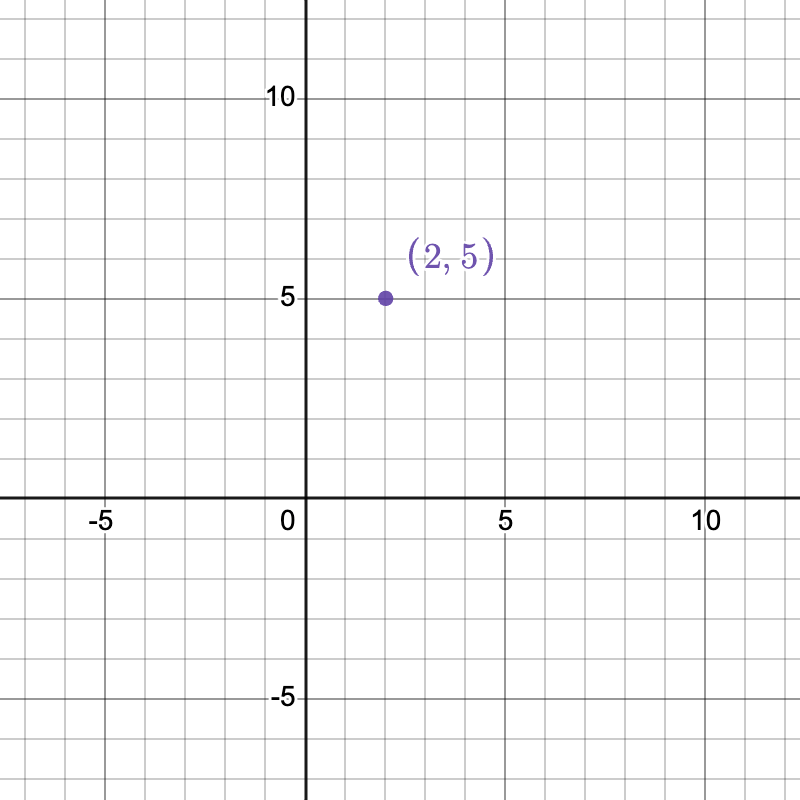
You are given a circle with a center at (2,5)(2,5) with a radius of 33 units. You are tasked with graphing this circle.

It is always best to start by plotting the center of the circle. That will give you an idea of where the circle lies on the coordinate plane.

Graphed point (2,5)

Graph created by Desmos

We can see that the center of this circle lies in the first quadrant.

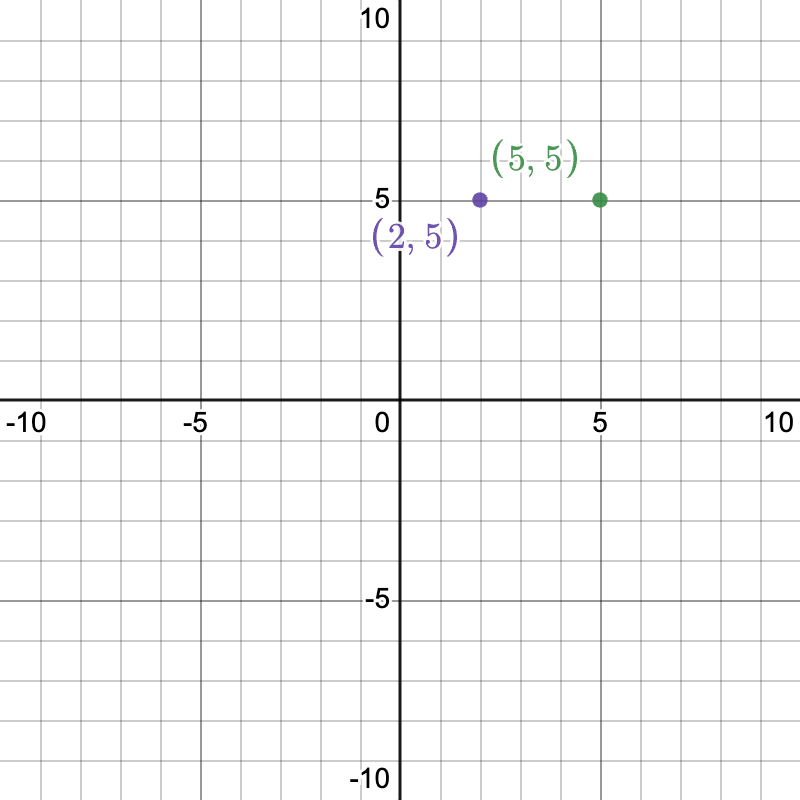
Our next step is to figure out how to plot the radius of the circle. We know that the radius is 33 units. That is the distance from the radius to any point on the circle. I find it easiest to plot four points on the circle using the radius, and then connect the lines. Let's plot the first point, 33 units away from the center of the circle.

Graphed points (2,5) and (5,5)

Graph created by Desmos

We can now plot three more points, all being 33 units away from the center of the circle, (2,5)(2,5).

Graphed points (2,5), (5,5), (-1,5), (2,8), (2,2)

Graph created by Desmos

You may start to see the form of a circle! We know this shape will eventually be a circle, so we can connect the points together.

Graphed points (2,5), (5,5), (-1,5), (2,8), (2,2), with an orange circle drawn connecting the points

Graph created by Desmos

We now have our graphed circle! For your reference, here is the equation of this circle:

(x−2)2+(y−5)2=9(x-2)^{2}+(y-5)^{2}=9

Type a concept, like “slope” or “photosynthesis”.

↑ ↓ to choose · Enter to openSearch explanations and problems