文字题

Before this, know平均值中位数众数

Video · + 2 min read

(Video) Word Problems: When to Use Mean, Median, and Mode

by Anusha Rahman

This video by Anusha Rahman goes over three examples of when to use mean, median, and mode in word problems.

Summary

Example 1: Jessie’s math teacher said that their final class grade is based on the average of all exam grades. Jessie has gotten a 93,87,71,93, 87, 71, and 9797 on her math exams. What measure of central tendency will she use to calculate the average? What is the average?

We know that when we see the word average, we're talking about the mean! So, we will be using mean to solve this problem.

Mean=93+87+71+974\text{Mean} = \frac{93+87+71+97}{4} =3484=\frac{348}{4} =87=87

So, we know that Jessie's average score on her math exams was 8787!

Example 2: Meghan wants to get an accurate picture of household salary in her neighborhood. The salaries for people in her neighborhood are: 87,000;94,000;103,000;97,000;87,000; 94,000; 103,000; 97,000; and 55,00055,000. What measure of central tendency will most accurate describe the data?

At first glance, we can see that there is an outlier at 55,00055,000. At outlier is going to mess with the mean, and mode (the frequency) is not going to give us a lot of information. So, we will use the median, or the middle value.

Step 1: Put the salaries in numerical order, from least to greatest.

55,000,87,000,94,000,97,000,103,00055,000, 87,000, 94,000, 97,000, 103,000

Step 2: Cross of the numbers evenly from each side until you're left with a middle number.

In this case, the median is 94,00094,000.

Example 3: At her birthday party, Charlotte asks everyone to go around and say their favorite Taylor Swift song. In order, people respond with:

All Too Well, Shake it Off, Black Space, New Romantics, All Too Well, New Romantics, All Too Well, and Mr Perfectly Fine

Charlotte wants to know which song is the most popular. What measure of central tendency should she use?

Because the question is asking for the most popular song, we know we are looking for the mode! We also know that the mean and median cannot be used for nominal or qualitative data.

Our first step is to make a frequency table with the data.

SongFrequencyAll Too Well3Shake It Off1Blank Space1New Romantics2Mr. Perfectly Fine1\begin{array}{|c|c|} \hline \text{Song}&\text{Frequency}\\ \hline \text{All Too Well} &3\\ \text{Shake It Off} &1\\ \text{Blank Space} &1\\ \text{New Romantics} &2\\ \text{Mr. Perfectly Fine} &1\\ \hline \end{array}

From this frequency table, we can see that All Too Well has the highest frequency, so that is the mode of the data set, and it is the most popular song!

When solving word problems with central tendency, it's important to understand the pros and cons of each type. Let's break them down.

Median:

PRO: asymmetrical data (with an outlier)

CON: doesn't work with qualitative or nominal data

Mean:

PRO: symmetrical data (no outlier)

PRO: big data sets

CON: highly affected by outliers

Mode:

PRO: working with qualitative or nominal data

PRO: very easy to look at and read graphs/charts

CON: very limited in what it tells you

Video · + 1 min read

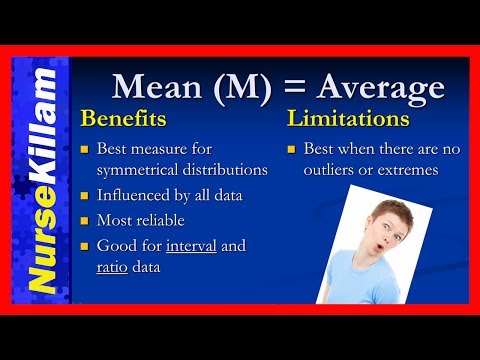
(Video) Understanding and Calculating Measures of Central Tendency

by Nurse Killam

This video by Nurse Killam explains when to use mean, median, and mode.

Summary\large{\text{Summary}}

She starts with the definition of a normal distribution. All of the measures of central tendency work best with a normal distribution.

Mean

The mean is the average of a data set. We find the mean by adding all of the values, and dividing the sum by the number of values. The mean gets more accurate with more values.

Mean Benefits

  • Best measure for symmetrical distributions
  • Influenced by all data
  • Most reliable
  • Good for interval and ratio data

Mean Limitations

  • Works best with no outliers

Median

The median is the middle value of a set. We find this by ordering the data, then finding the literal middle number. Even sized sets will have two numbers that share the middle. The median of these sets is the average of those two numbers.

Median Benefits

  • Good for asymmetrical data
  • Works for ordinal, interval, and ratio data

Median Limitations

  • Does not account for extreme scores
  • Not algebraically defined
  • Not appropriate for nominal data

Mode

The mode is the value that occurs the most in a set. We find this by ordering the set and finding the number that repeats the most.

Mode Benefits

  • The only appropriate measure for nominal data
  • Can also be used for ordinal, interval, and ratio data

Mode Limitations

  • Cannot be used if all scores are different
  • There can be several modes
  • Cannot be used for further calculations
  • Unstable

Read · 3 min

When to Use Mean, Median, and Mode

Three extremely important measures of central tendency (part of statistics) are mean, median, and mode. You can find the mean, median, and mode of most data sets. Sometimes, it is more advantageous to only focus on one or two of these measures of central tendency, depending on your data set. Let's find out when we should use the mean, median, or mode to accurately describe a data set.

Mean

The mean is the average value in a data set. We can calculate the mean using the following formula:

mean=sum of all valuestotal number of values\text{mean} = \frac{\text{sum of all values}}{\text{total number of values}}

Advantages:

The mean is the best measure for symmetrical data distributions. It is affected by all of the data points, and the more data points you know, the more accurate the mean will be. The mean is helpful when working with interval and ratio data.

Limitations:

Outliers can really throw off the mean. For example, say we have the data set {1,4,5,6,6,7,8,8,9}\{1, 4, 5, 6, 6, 7, 8, 8, 9\}. The average of this data set is 1+4+5+6+6+7+8+8+99=549=6\frac{1+ 4+ 5+ 6+ 6+7+ 8+ 8+ 9}{9} = \frac{54}{9} = 6. But, what if we had an outlier in the set? What if our new set was {1,4,5,6,6,7,8,8,9,4946}\{1, 4, 5, 6, 6, 7, 8, 8, 9, 4946\}? When our new mean would be 1+4+5+6+6+7+8+8+9+494610=500010=500\frac{1+ 4+ 5+ 6+ 6+7+ 8+ 8+ 9 + 4946}{10} = \frac{5000}{10} = 500. See how much an outlier can throw off the mean?

Median

The median is the value separating the first half of the data set with the second half. To find the median of a data set, first put the data set in order. Then, if there are an odd number of values, cross an equal amount of values off from the beginning of the list and the end of the list. The remaining data point in the middle of your list is the median! If there are an even number of values in your set, the median will be the average of the two middle values.

Advantages:

The median is helpful when describing asymmetrical data, and it also works for ordinal, ratio, or interval data. It is easy to find, especially if your data is in order. Also, it is not usually too affected by outliers.

Limitations

However, the fact that the median is not usually affected by outliers means that we can't use it to account for these extreme values. Also, the median is not helpful when we are working with nominal or qualitative data. Think about it ... how can you order a list of colors and find the middle color?

Mode

The mode of a data set is the value that occurs most frequently. We can find the mode by putting the data in order, and then identifying which value(s) repeat the most. Frequency tables, histograms, and frequency distributions can be helpful in identifying the mode.

Advantages:

Finding the mode can be especially helpful when we are working with qualitative data or nominal data, but it can also be used when we have ordinal, ratio, or interval data. It's easy to spot on a graph, frequency table, or even an ordered set of data. It is not usually affected by outliers.

Limitations:

There can be many modes, so finding the mode may not say much about how the data is distributed. On the other hand, if all the data points only occur once, there is no real mode. The mode is unstable, and can be easily influenced by certain changes in the data. Adding just one new data point can change the mode!

Interactive · 2 questions

Using the Measures of Central Tendency: Media, Median, and Mode

When you're faced with word problems where you're asking to look into the distribution of a dataset, it can feel intimidating to figure out whether to use mean, median, or mode. The good news is that because each measure is different, they each have their own advantages and disadvantages!

In later lessons, we will dive into scales of measurement!

Using the Measures of Central Tendency
Mean: 
+best for symmetrical data
+best for large datasets
-easily thrown off by outliers
Median
+best for asymmetrical data
+easy to find
-not useful for qualitative data
Mode
+best for qualitative data
+easy to find
-there can be multiple modes

Image source: by Anusha Rahman

Let's go through some example problems.

Which measure of central tendency is the most effective way to analyze the following dataset? 4,7,9,10,11,18,2,20,15,350,144, 7, 9, 10, 11, 18, 2, 20, 15, 350, 14

Choose one answer

Type a concept, like “slope” or “photosynthesis”.

↑ ↓ to choose · Enter to openSearch explanations and problems