Interactive · 3 questions

Standard Deviation - What is it and how do I find it?
In these set of lessons, we're learning about the measures of central tendency. We'll learn about median, mode, mean, range, standard deviation, and statistical significance.
Standard deviation is a measure of how spread apart the numbers in a data set are. It is a single number that can help us figure out whether the numbers in the data set are clustered super close together or if there is a pretty wide range of values.

Image source: By Caroline Kulczycky
Imagine that you make a histogram of your data. If you need a refresher on histograms, click here. Once you make a histogram, you can imagine a smooth curve tracing the tops of your bars, like the graphs above.
If you've got values that are all pretty close together (i.e., there's not much spread to the data), your curve will look like the one on the bottom. You can see that the curve is scrunched up (the technical term) - there is a low standard deviation. This tells us, just by looking at the graph, that there's not much variety or spread in our data.
If you've got values that are more spread out (i.e., there's more spread to the data), your curve will look like the one on the top. You can see that the curve is wider than the one on the bottom - there is a greater standard deviation.
Example
Of the two data sets above, which one has the largest standard deviation ()?
We use the greek letter sigma to represent standard deviation.
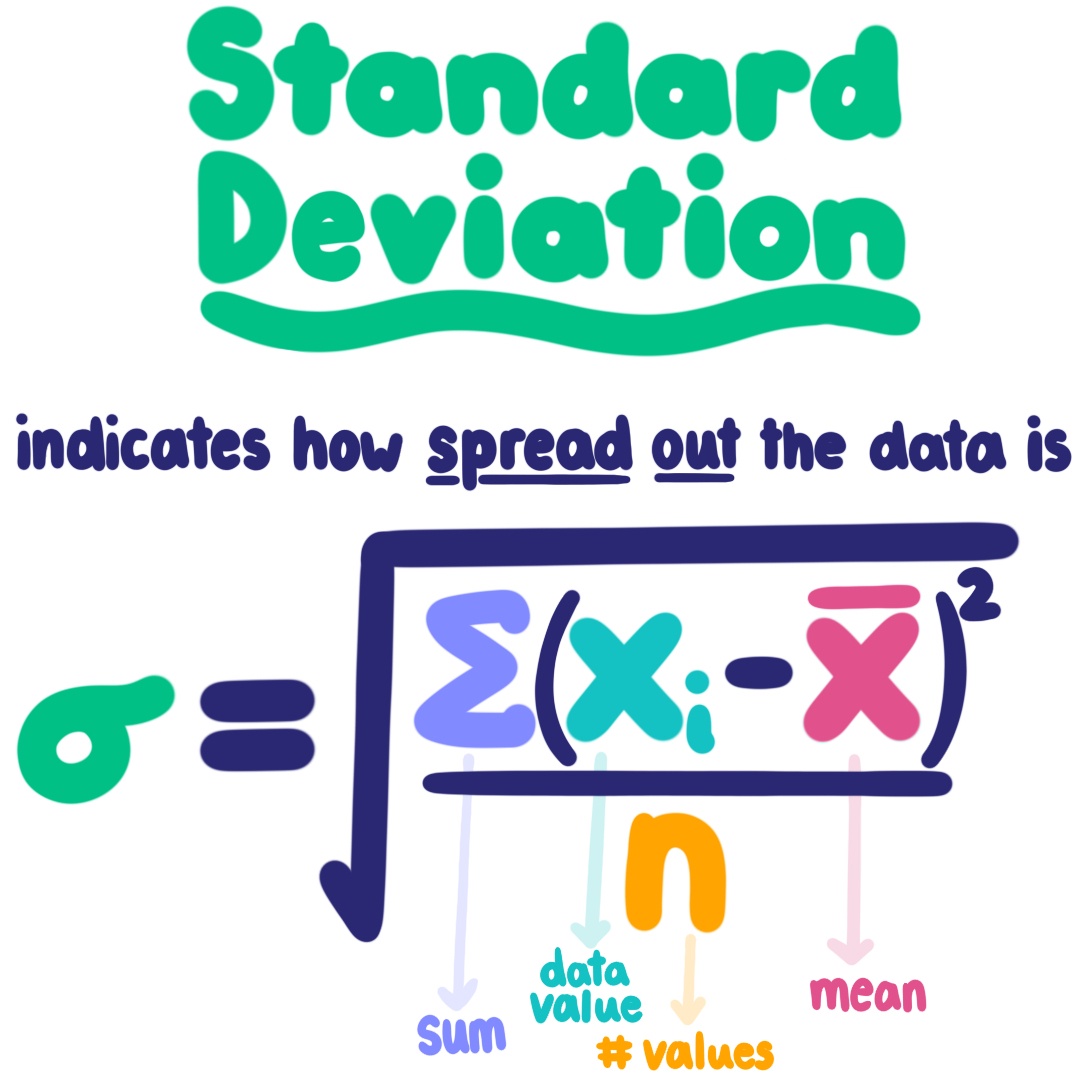
Image source: By Caroline Kulczycky
If that doesn't help, here are the steps to follow to calculate standard deviation:
Step One: Find the mean (average) of your data set.
Step Two: Subtract the mean from each value in your data set and square the difference.
Step Three: Add up the results from Step Two.
Step Four: Divide your sum by the total number of values in your data set.
Step Five: Take the square root of the result.
Let's try this out with Data Set A we looked at previously. The values were:
Step One: Find the mean (average) of your data set.
What is the mean of Data Set A?
Step Two: Subtract the mean from each value in the data set and square the difference.
Step Three: Add up the results from Step Two.
Step Four: Divide your sum by the total number of values in your data set:
How many values are there in our data set?
So, when we divide the sum by the total number of values, we get:
Step Five: Take the square root of the result.
So, the standard deviation of Data Set A is