Illustrated · 1 min
+1 contributors

We have already learned how to create box and whisker plots using the upper and lower quartiles and the interquartile range. While just one box and whisker plot can tell us a lot about the dataset, comparing multiple box and whisker plots is very helpful because it can help us contrast the variability of datasets.
Let's look at two example data sets of the amount of apples found in a bushel sold at the store and their respective box and whisker plots:
Data set #1: 32, 40, 26, 41, 29, 17, 35, 33
Data set #2: 12, 9, 36, 21, 19, 22, 27, 14, 11, 30, 16, 42, 25
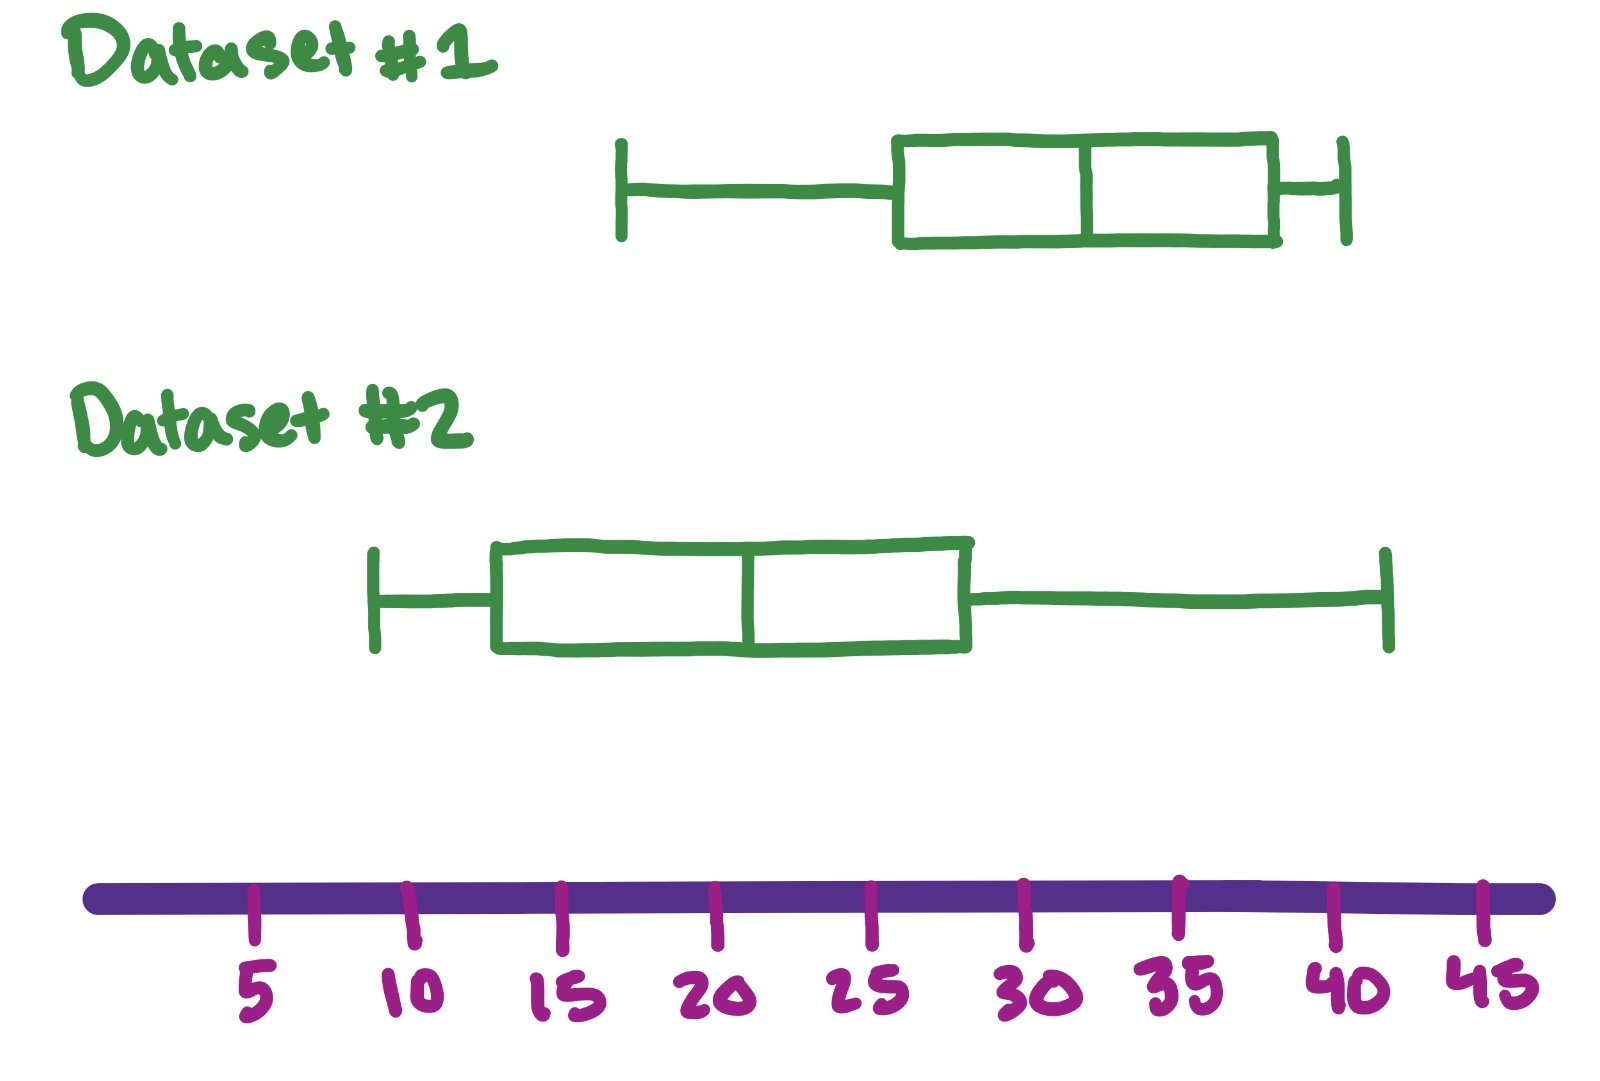
Image source: by Trisha
Now that we have plotted both box and whisker plots, we can analyze them together.
The first aspect to look for is the overall distribution.
Which has a wider/shorter distribution? In our above example, dataset #2 is much wider and spread-out, so the data is more variable.
Do the boxes overlap? Yes, the boxes overlap slightly, meaning their IQR's overlap, so the datasets aren't very different. If the IQRs don't overlap, then the datasets are different.
Is the data skewed? In other words, does the data seem to favor the left side or right side? In our example, Dataset #1 skews left while Dataset #2 skews right.
Next, compare the medians by looking at the middle line of the box and whisker plot.
We can see that Dataset #1 has a larger median than Dataset #2. The medians also do not overlap with the box of the other plot, so we can say that the two groups are different.
Finally, check for outliers. Outliers are denoted by points on the plot, not part of the whiskers.
Using all of this information, we can conclude whether the datasets are different and to what extent.