Illustrated · 1 min

Box-and-whisker plots

A box-and-whisker plot (sometimes called a boxplot) is a graph that illustrates five values (lower extreme, lower quartile, median, upper quartile, upper extreme).

It is especially useful for indicating whether the data is skewed and whether or not there are outliers present.

In this type of plot:

  • the ends of the box are the upper and lower quartiles
  • the length of the box spans the interquartile range (IQR)
  • the median is marked by a vertical line inside the box
  • the whiskers are the two lines outside the box that extend to the highest and lowest values in the data set
  • any outliers are indicated as dots outside of the whiskers
  • if there are no outliers, the difference between the whiskers is the range
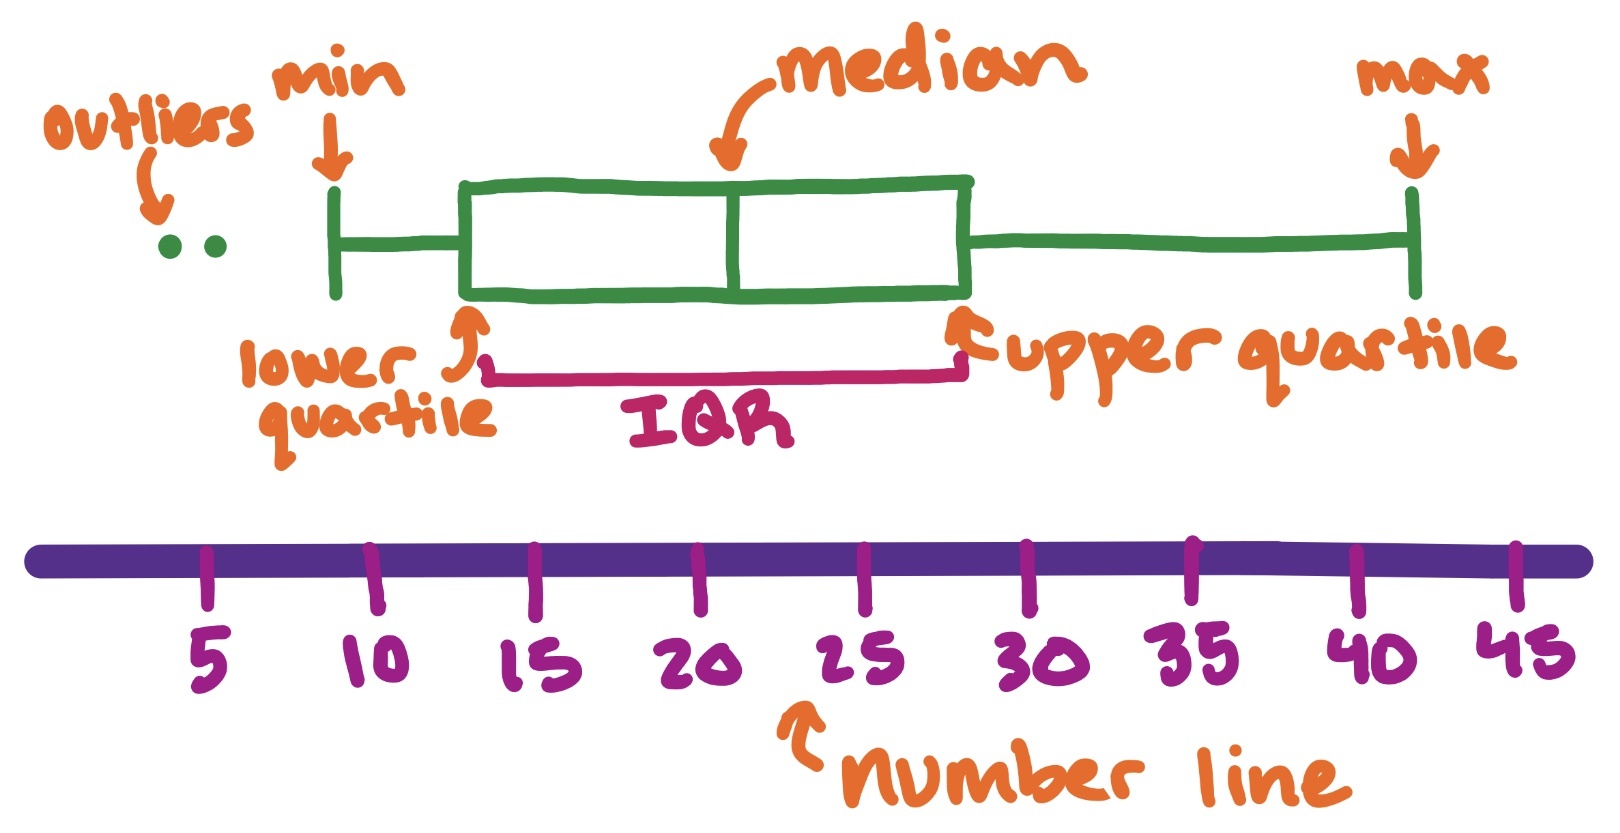
Box and whisker plot over number line. The outliers, minimum, lower quartile, interquartile range, median, upper quartile, and maximum labeled.

Image source: by Trisha

In the example above, we can see the key features labeled. We can also see that the dataset is skewed to the right.

Box and whisker plots aren't just useful individually; they can also be very informative to compare multiple datasets.

Video · + 1 min read

(Video) BOX AND WHISKER PLOTS EXPLAINED!

by Mashup Math

As we have been thinking about variability in statistics, we have learned about standard deviation, variance, and the mean absolute deviation, so now let's learn about a new way to model a dataset.

Check out this video by Mashup Math to learn about how to make a box and whisker plot from a dataset.

First, it is helpful to rearrange the data from least to greatest.

Next, identify the upper extreme and the lower extreme, also known as the maximum and minimum values.

Then, find the median. Once the median is found, find the upper and lower quartiles by finding the median of the first and second half of the data each. Recall from the lesson on the interquartile range how to find the quartiles.

Now you have these five important values!

Over a number line, mark the upper and lower extremes, median, and upper and lower quartiles. Then, draw a vertical line through the upper and lower quartiles and the median and draw a box around the lines. Finally, draw a horizontal line connecting the box to the upper and lower extremes.

Follow along with the example problems in the video!

Illustrated · 1 min

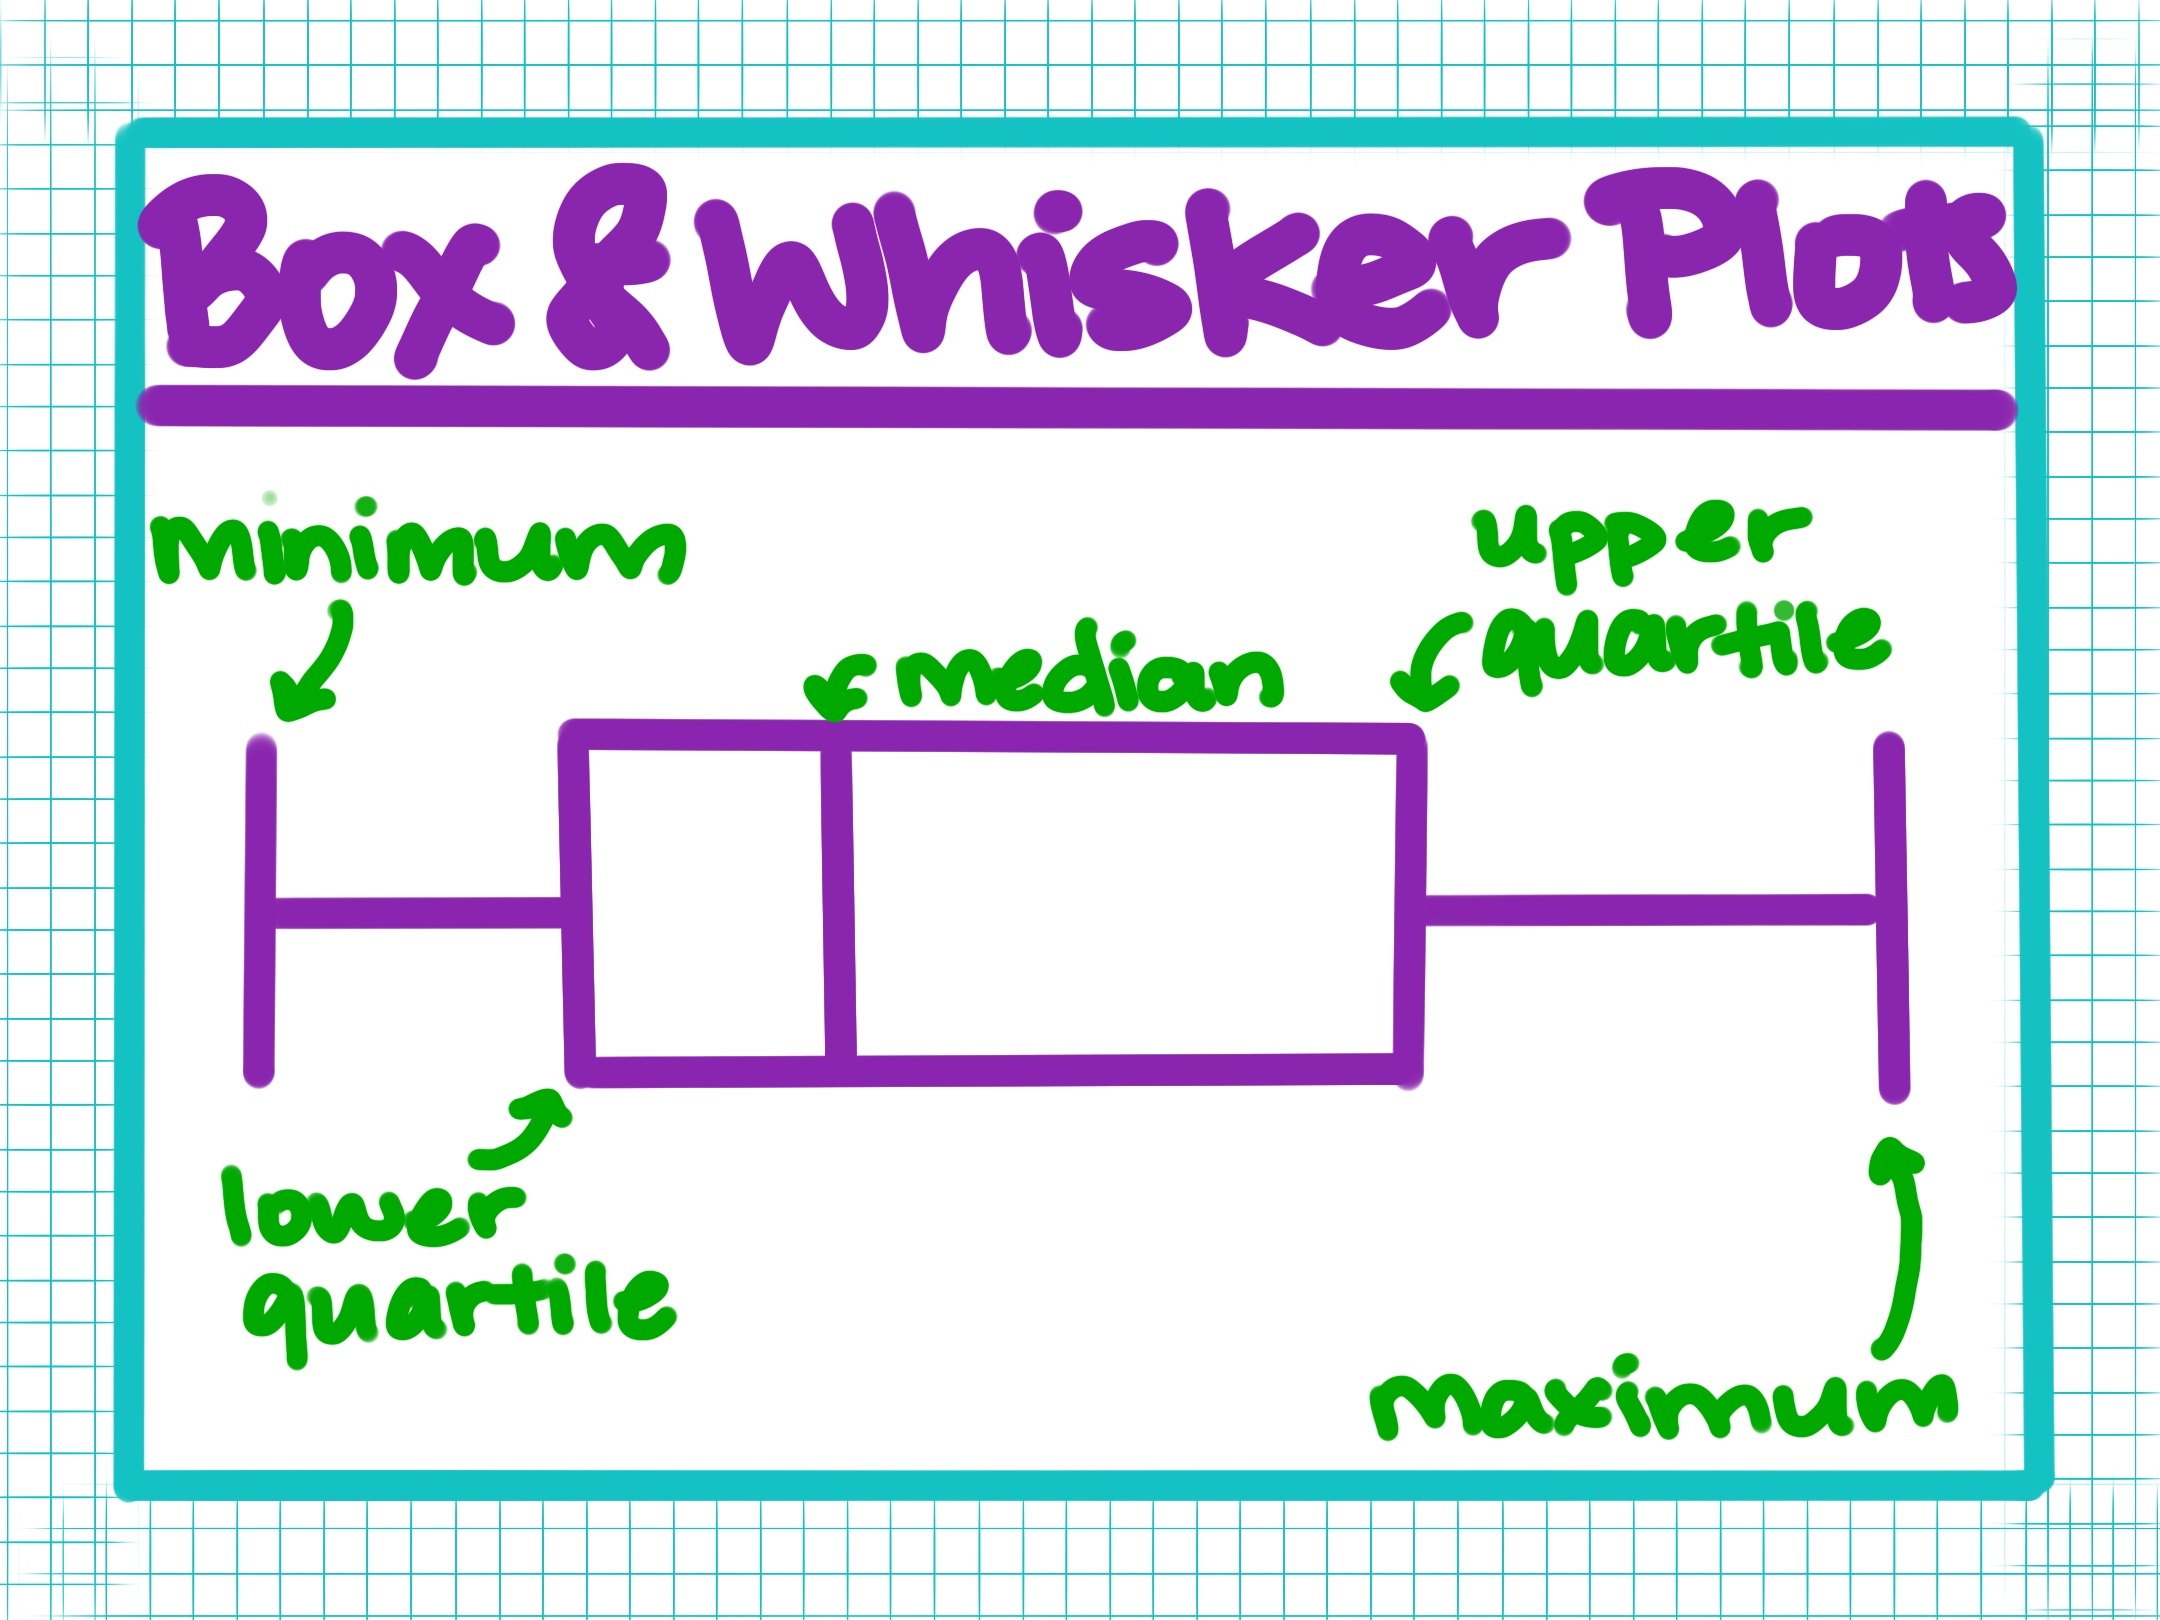
Box & Whisker Plots

In addition to scatterplots, bar graphs, and other types of plots & graphs we've learned about, math also uses the box & whisker plot (aka box plots!).

Box & Whisker Plots

Image source: by Anusha Rahman

Box & whisker plots are used to represent range and quartile data. They are especially useful for comparing distributions and seeing a number summary, like with test scores. The lowest quarter of the data, or the 25th25th percentile, is known as the lower quartile. The upper quartile makes up the top 25%25\% of the data. Lines extending out of the box are the data not concentrated.

The downside with a box plot is that it is not meant to understand the individual datapoint.

Type a concept, like “slope” or “photosynthesis”.

↑ ↓ to choose · Enter to openSearch explanations and problems
