Interactive · 5 questions
+5 contributors



Finding the slope of a line on a graph is pretty similar to using points or coordinates to find a slope, but it can be a lot more visual. In this explanation, I'll walk you through the whole process.
Finding the Slope of a Line on a Graph Using Rise Over Run
If you need to find the slope of a line using a graph, first you'll need a graph. Let's use this one.

Made using Desmos
What are the coordinates of the point (the dot labeled ) I've drawn on this graph? Remember, (or the number that matches the point along the horizontal axis) goes first. Make sure you put your coordinates in parentheses just like this:
Awesome! That point is because it is steps to the right of the origin point and steps up. Now, to find the slope we need to compare two points on the line, so let's find another point:
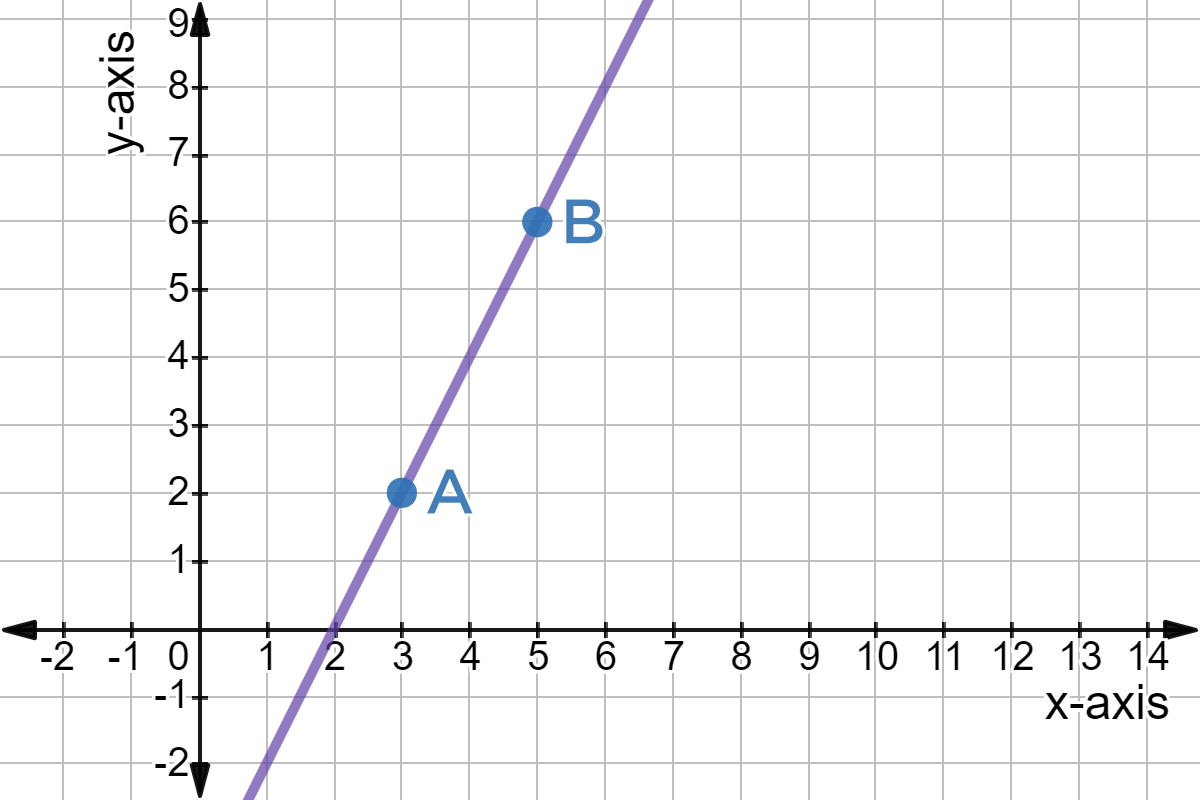
Made using Desmos
I've chosen point as point . If points aren't already chosen for you on the graph, remember that you can always just choose them yourself. Any two places on the line will do!
Next, we can use those two points to find the slope of the graph by looking at the rise and run between points and , shown on this next image:
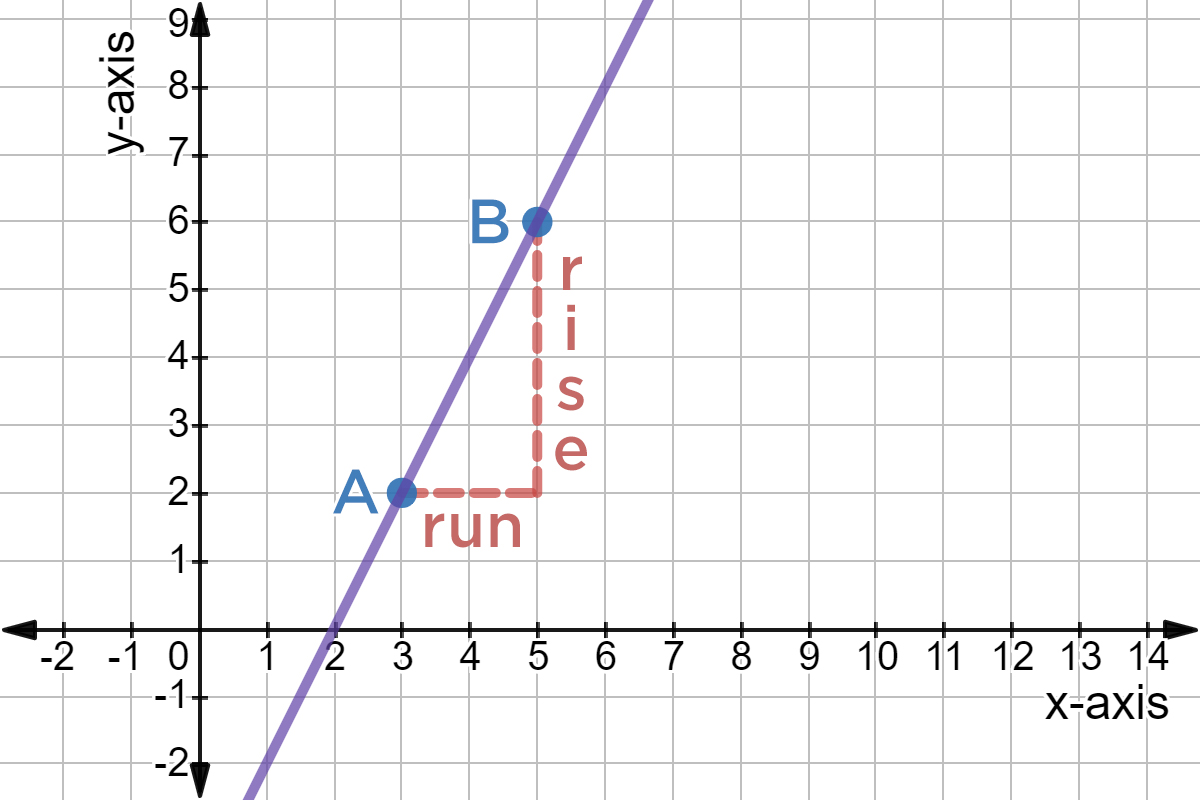
Made using Desmos
Rise is how much higher on the vertical () axis the point on the right is, compared to the point on the left. Run is how much further along the horizontal () axis the point on the right is, compared to the point on the left.
What is the rise from point to point ?
What is the run from point to point ?
Great! The rise from to is and the run is . Now, we can compare rise and run to find the slope:
In other words, if you put rise over run, you'll get a fraction that describes the slope of your line.
What is the slope of the line that points and are on?
Yep, it's . Congrats, you have your slope! But wait, this isn't quite the last step for us. You can still simplify your slope by simplifying the fraction.
What is the simplest form of the slope of the line that points and are on?
Alright, now you've got your final, simplified slope. We're done!
Overview
We've worked through a problem, but here are the steps so you can remind yourself of them later:
- Choose any two points on a line.
- Find the rise between those points by counting how many steps higher (or lower) the one on the right is than the one on the left.
- Find the run between those points by counting how many more steps to the right one is than the other.
- Place rise over run to get your slope:
- If you can, simplify your slope by simplifying the fraction.
- Done!
Another way to find slope is to use points!