Interactive · 4 questions

+3 contributors




Image source: by Alex Federspiel
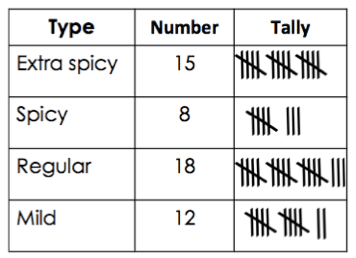
I'm sure you know what a table is already, but what is frequency? Frequency is how often something occurs, i.e., the number of times something occurs. Frequency is a branch of statistics.
For example, if you had a data set like , we would say has a frequency of since it appears three times.
A frequency table is a table of the data with their respective frequencies. It shares similarities to histograms and stem and leaf plots.
With our data set , the table would be:
What would be the frequency of in the data set:
Intervals
When we have larger data sets or larger ranges, we can use intervals to construct the frequency table.
Let's create a frequency table for the following data set.
Since this is kind of confusing to look at, let's put the data in ascending order first.
So, instead of counting the frequencies for and so on, we can group them into intervals like . Then, we just find the frequency for the intervals.
Using the data set above, suppose we had the frequency table: What would be the frequencies from top to bottom?
Filling in the frequency table, we get:
How do we know how many intervals to use and what their sizes should be? Unfortunately, there isn't really a definitive answer. Intervals shouldn't be too big and shouldn't be too small.
Here's another frequency table of the data but with different intervals.
Both of these are valid.
Intervals with Decimals
One important aspect is what we do with intervals when the data isn't only integers. Suppose we have the following data:
You might set the intervals for the table as follows:
But where would a number like fall for this?
When dealing with decimals, we can use stricter intervals.
Recall that the bracket means we include that number and the parenthesis means we go up to but don't include that number. So the first interval includes and all the numbers that go up to , but it doesn't include .
When making the frequency table, we don't include the brackets or the parentheses. It's just agreed upon that the left value in inclusive and the right value is exclusive.
If we fill in the frequencies, we get:
Given the following frequency table, in which interval would we count in for the frequency?
Reading the Table
Other than constructing a frequency table, you will also be asked to gather information from the table.
Suppose we have the following frequency table: How many data points are there?
We can always figure out how many data points there are by adding all the frequencies together.
What fraction of the data is between ?
To find this, we can take the frequency of the interval we want, , and place it over the total frequency.
How many data points are below ?
Just add up the frequencies of the intervals that are less than . These would be and .
Finally, there is some data that we can't find when using a frequency table. Frequency tables are a way to quickly generalize data. They are easier to read but the trade off is they can be less accurate.
For example, if you were asked how many 's were in the data given the above frequency table, we couldn't answer. We know the frequency for the values in the interval , but we don't know how many were exactly .
Looking at the current trending videos on YouTube, their run times are: Create the frequency table of this data using the intervals: and .
Oh How the Tables Have Turned...Into Histograms
Once you master making frequency tables, we can then turn the tables into a type of bar graph. These graphs are called histograms, which we'll learn next.