Read · 1 min

Graphing Hyperbolas
The standard form equation of a hyperbola centered at the origin is:
, where and are positive constants. The hyperbola has a vertical transverse axis if and a horizontal transverse axis if .
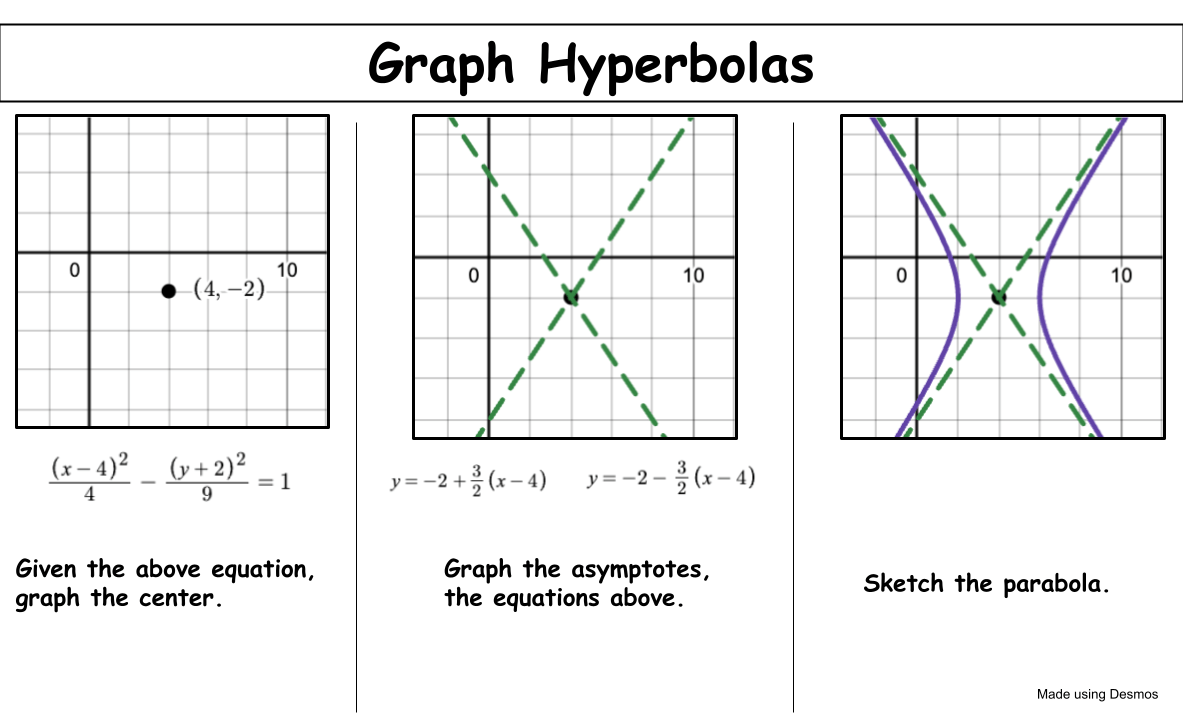
To graph a hyperbola from its equation in standard form, first you want to identify the center. We've already learned that the center of a hyperbola is at , where is the constant that is subtracted from . is the constant that is subtracted from .
Next, you want to determine the transverse axis. If , the transverse axis is along the -axis, and if , the transverse axis is along the -axis.
Then, you want to find the vertices. The vertices of the hyperbola are located at if the transverse axis is horizontal, or if the transverse axis is vertical.
Next, you can find the foci. The foci of the hyperbola are located at if the transverse axis is horizontal, or if the transverse axis is vertical, where is calculated using the equation .
Lastly, determine the asymptotes! The asymptotes are lines that the hyperbola approaches as x or y tends to positive or negative infinity. The slopes of the asymptotes are if the transverse axis is horizontal, or if the transverse axis is vertical. The asymptotes pass through the center of the hyperbola.
With all this given information, you can now plot the points and sketch the hyperbola!
Remember that the shape of the hyperbola is determined by the difference in the squares of and , which is why one term is subtracted from the other in the standard form equation. The larger denominator will determine the direction of opening of the hyperbola.