Graphing Exponential Equations
An exponential equation is a function where the variable is the exponent:
y=ax
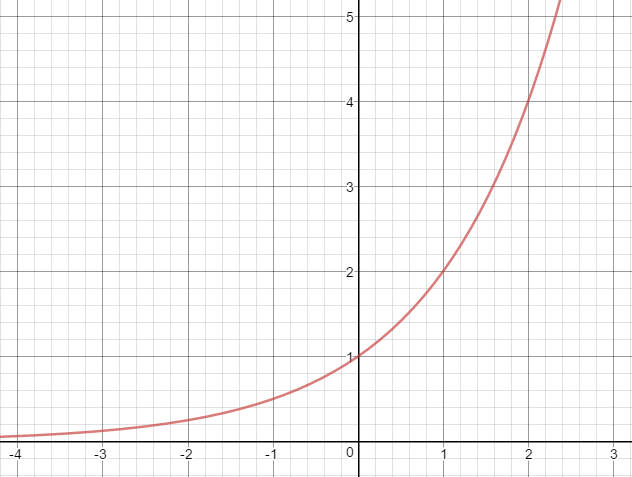
In this equation, a is a positive real number, and it's called the base. The graph of the equation creates a smooth curve that increases or decreases quickly.
To know if the graph is increasing or decreasing:
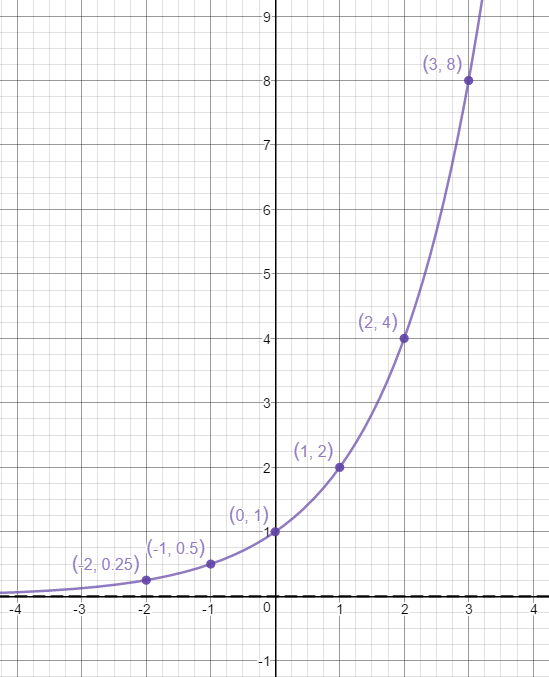
- If a>1, the graph shows exponential growth, meaning it curves upward as x increases.
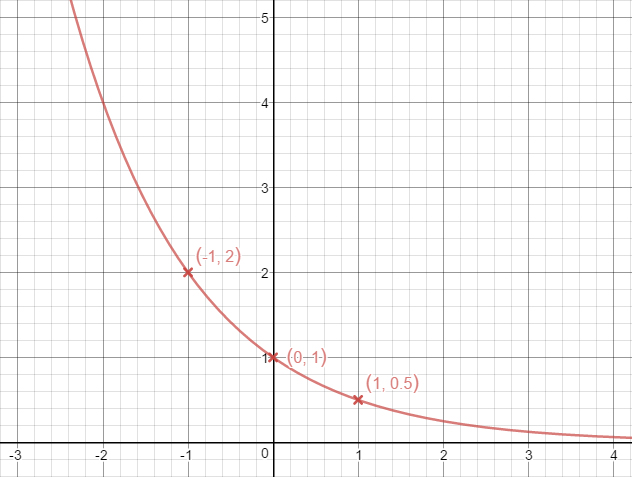
- If 0<a<1, the graph shows exponential decay, meaning it curves downward as x increases.
Every exponential graph passes through the point (0,1) because any number raised to the power of 0 is 1. The graph will also have a horizontal asymptote, usually at y=0. That means that the curve gets close to the x-axis, but never touches it.
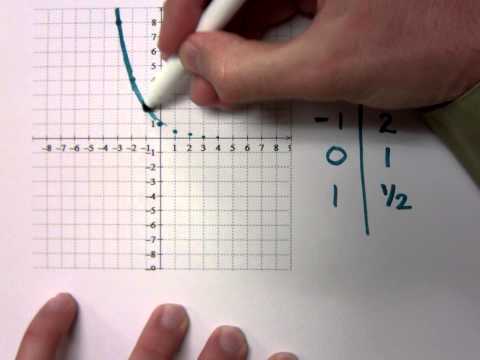
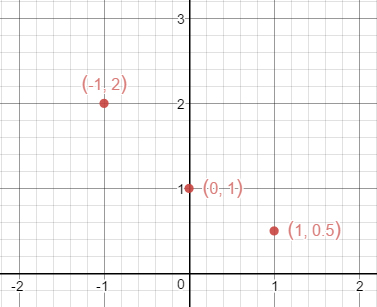
The best way to graph an exponential equation is to make a small table of values for x, plug them into the equation, and find the matching y values. Then, plot the points on a coordinate plane and connect them with a smooth curve.