Interactive · 2 questions
+2 contributors
Contributors


In a quadratic equation, the represents the coordinate for how high up each point on the curve is. Take a look at the graphs below. They all have the same slope, or they all are the same steepness, but the only difference is that their vertexes are at different points on the - axis!
Okay. There are graphs on the coordinate plane. The red one is .
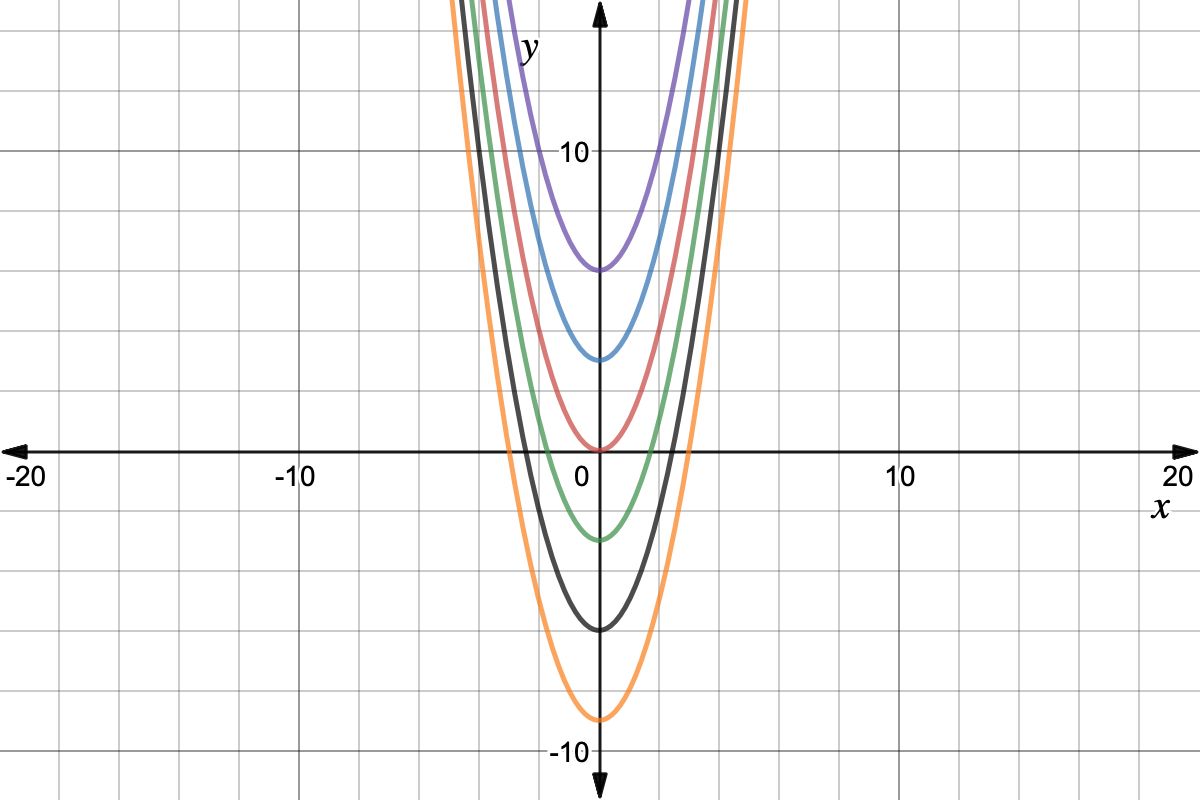
Graph courtesy of Desmos
Can you figure out which graph is ?
The blue graph has the equation . Therefore, the purple graph has equation , the green graph has equation , and the black and orange ones lie even further below
Where would the vertex of be compared to the - axis?