Recordemos: y=ax^2+bx+c

Before this, knowO que seria uma equação quadratica?

Illustrated · 3 min

Upon entering any new topic, we have to familiarize ourselves with new vocabulary. Quadratics are no exception to this rule.

Refresher: a quadratic function is a function that takes the form f(x)=ax2+bx+cf(x)=ax^2+bx+c and creates a parabola (U shape) when graphed.

When discussing quadratic functions, certain terms will pop up a lot such as: concavity, vertex, parabola, axis of symmetry, minimum, maximum, and zeros. \\ A parabola is a "U" shaped curve that typically opens up like a smile or down like a frown.

The term concavity refers to the way a parabola opens. A parabola can be described as concave up or concave down, depending on which it opens. The image below shows what it means to be concave up and concave down.
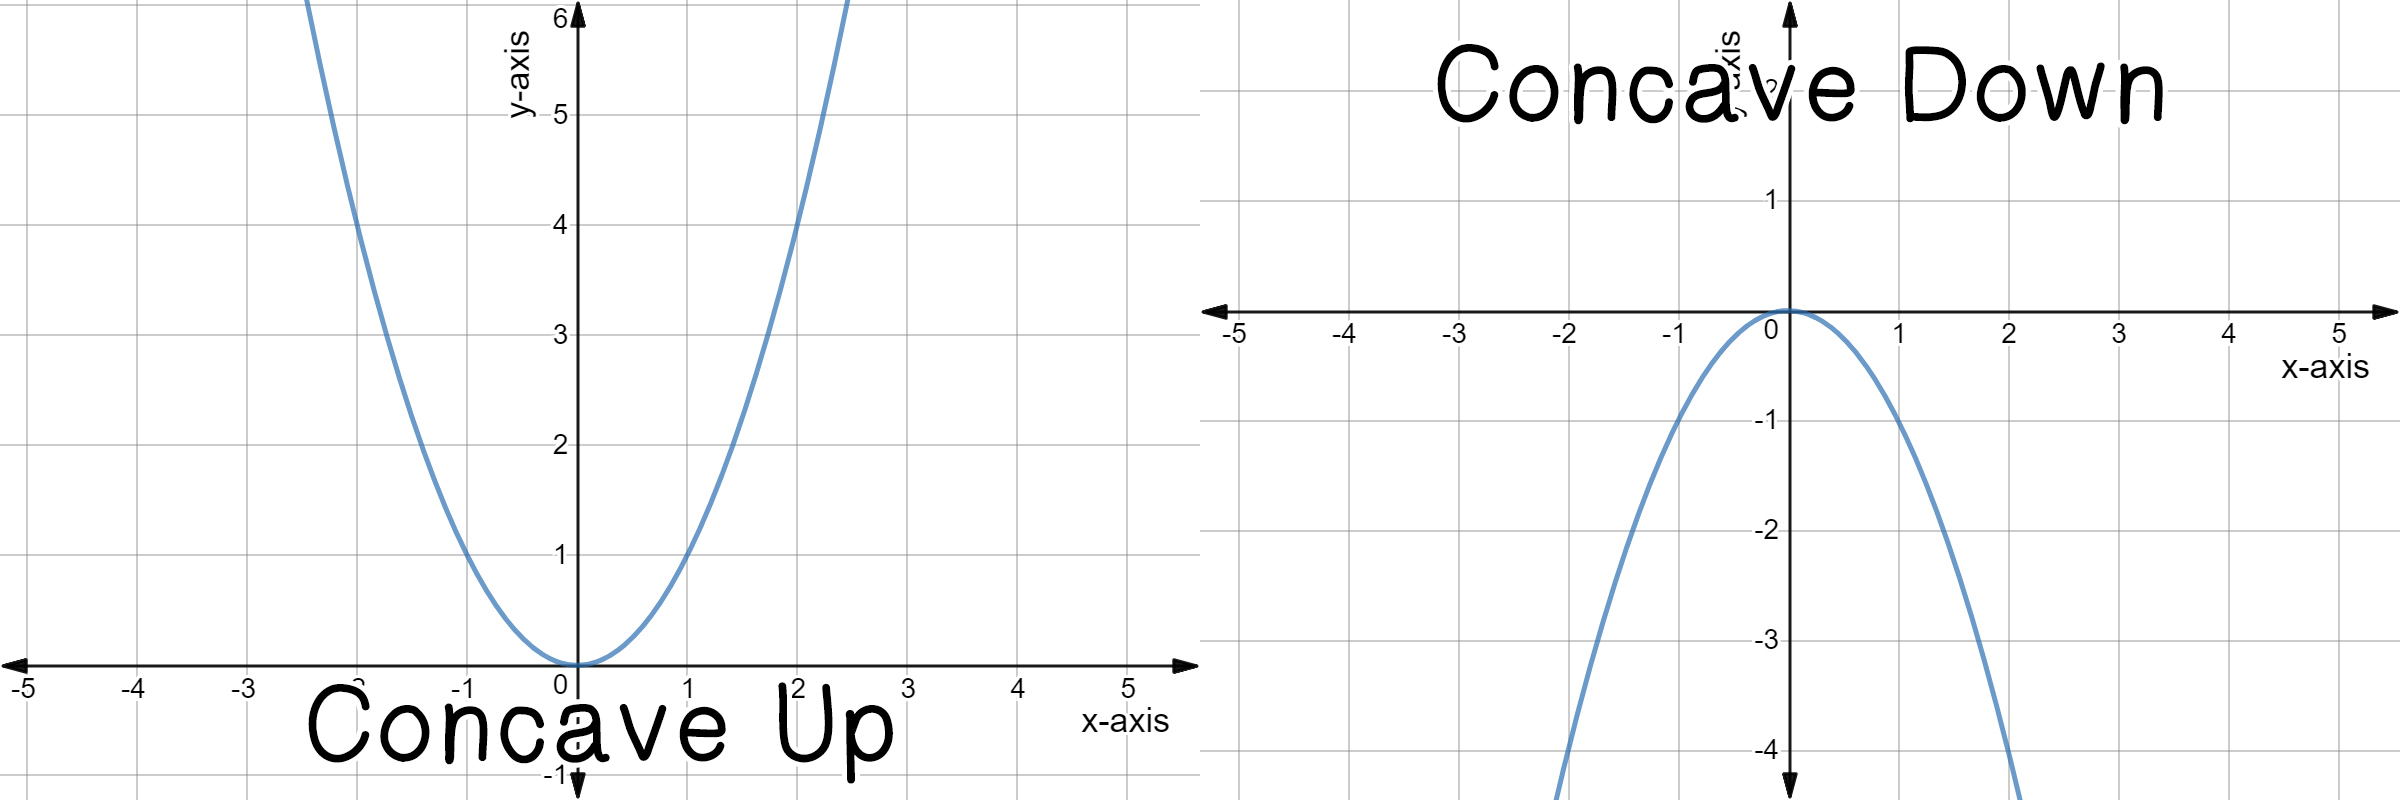
Quadratic graphs of y = x^2 and y = -x^2. The first is concave up the latter is concave down.

Made using Desmos

When given a function we can determine concavity simply by the sign of the x2x^2 term coefficient. i.e. When the x2x^2 coefficient is negative the parabola is concave down. On the other hand, when the x2x^2 coefficient is positive, the parabola is concave up. Finally, if the x2x^2 coefficient is zero, there is not a parabola to begin with!

Notice the yy-axis in each of the above graphs. This axis runs straight down the middle of both parabolas creating a line of symmetry in the graph. Every parabola has something called an axis of symmetry, which is a line with the equation x=cx=c where cc is a constant. This line essentially splits the parabola into two equal halves. They are reflections of each other about the axis of symmetry. Below is an example of an axis of symmetry that does not fall on the yy-axis. The purple line in the graph has the equation x=4x=4 and it is the axis of symmetry for the parabola.

Parabola with vertex at (4,-19). There is a line running through the center of the parabola with the equation x=4.

Made using Desmos

Now notice the point in the graph where the axis of symmetry and the parabola intersect. That point is known as the vertex of the parabola. The vertex of a parabola is the point where the graph changes directions. We already know the standard form is ax2+bx+c=0ax^2+bx+c=0, however there is another form to denote a quadratic equation. That form is known as vertex form, this form lists the vertex in the equation.

Vertex form: y=a(x−h)2+k\text{Vertex form: } y=a(x-h)^2+k

Where (h,k)(h,k) is the vertex and aa is the same as the aa in standard form. If we only have the quadratic function in standard form, ax2+bx+c=0ax^2+bx+c=0, the following formula can be used to find the vertex: h=−b2ah=\frac{-b}{2a}

The vertex is also the minimum or maximum point of a parabola. If a vertex is the minimum point on the parabola, that means it is the smallest value of the function. If a vertex is the maximum point on the parabola, that means it is the largest value of the function. The images below show examples of minima and maxima of parabolas.

y = x^2 has a minimum at (0,0) and y = -x^2 has a maximum at (0,0).

Made using Desmos

It is worth noting that every parabola will have either a minimum or a maximum, but not both. Parabolas always extend in one direction infinitely.

The final term to familiarize yourself with is zeros. Zeros are also called xx-intercepts or roots. The zeros of a function are the points that a function intersects the xx-axis. A parabola can cross the xx-axis up to two times, but sometimes it may not touch xx-axis. A quadratic function can have zero, one, or two distinct zeros. The image below shows three different parabolas, each with a different number of distinct roots. Graphing a quadratic equation and looking at its xx-intercepts is a great way to find the solutions to the equation!

One key thing to note: the quadratic with one root has a distance of 00 from the origin.

Graph of y = (x+3)(x-0.5) on the left, y = x^2 in the center, and y = x^2+5 on the right.

The leftmost function has no roots, the center one has one root, and the right most has 0 roots.

Made using Desmos

Two other things we want to keep track of is the focus and directrix.

Coordinate plan with parabola, focus, and directrix. One line is drawn from the focus to a point on the parabola, and a second line is drawn from a point on the directrix to a point on the parabola. These two lines are the same distance.

Image source: by Anusha Rahman

On the image, you can see two lines in purple: one drawn from a point on the directrix to a point on the parabola, and one drawn from the same point on the parabola to the focus. The distance of the first purple line equals the distance of the second purple line. If the image had numbers, you could use the distance formula to double check!

On the graph, the blue dot is called the focus.

Another interesting feature of the parabola is that if we were to make it 3D, it would look like a conic section! You'll learn more about this later.

Math as a puzzle

Many contest problems feel more like puzzles than homework. They are a good way to find out how much fun math can be. These are real problems from the AMC 12, the national math competitions for middle and high school students, each with a worked solution on LIVE by Po-Shen Loh.

Video · + 1 min read

(Video) Key Features of a Parabola

by InspireMathTutorials

This video by InspireMathTutorials covers the parts of a parabola.

Summary\large{\text{Summary}}

A parabola is the graph of a quadratic, written as f(x)=ax2+bx+cf(x)= ax^2+bx+c

Every parabola has a vertex, an axis of symmetry, a maximum OR minimum value, and a yy-intercept. Most but not all also have at least one xx-intercept. Let's define these terms.

Vertex: The point where the function changes direction.

Axis of Symmetry: The vertical line that splits the parabola in half. It goes through the vertex.

Maximum/Minimum Value: Graphs that open upwards have a minimum, and graphs that open downwards have a maximum. These values are the yy-coordinate of the vertex.

yy-intercept: The point where the parabola crosses the yy-axis.

xx-intercept: The point(s) where the parabola crosses the xx-axis. Parabolas can cross the xx-axis two times, one time, and in some cases no times.

Let's look at at a graph of a parabola that has all of these parts.

Graph of f(x)=x^2-2x-8.

Made with Desmos

Let's list out all of the parts of this parabola.

The vertex is the red point. It is (1,−9)(1,-9).

The axis of symmetry is the dotted orange line. It is the line x=1x=1.

This parabola has a minimum value. It is the yy-value of our vertex, which is −9-9.

The yy-intercept is the green point, (0,−8)(0,-8)

This has two xx-intercepts, both labeled with purple points. They are (−2,0)(-2,0) and (4,0)(4,0).

Just so you can see what it looks like, here is a parabola that has a maximum and no xx-intercepts.

Graph of $f(x)=-x^2-2x-8$.

Made with Desmos

Illustrated · 2 min

Three Key Features of Parabolas

When you graph a quadratic function, you get a parabola, with three key features. Three of these features are the direction, vertex, and zeros.

All parabolas take on the same shape: it is similar to a U shape with a pointy top.

Direction

A parabola can face up or down. The equation of a parabola is the equation of a quadratic.

What part of the quadratic function affects the direction?

Recall the standard form of a quadratic equation looks something like this: ax2+bx+c=0ax^2 +bx +c=0

When aa is positive, the parabola faces up.

Quadratic graph of y = x^2.

Made using Desmos

When aa is negative, the parabola faces down.

Quadratic graph of y = -x^2.

Made using Desmos

The function can take on other forms, but can always manipulate it into standard form. That being said, you can determine the sign of aa without writing the function in standard form—it just takes some practice!

The locus of all points in the parabola will be above the vertex in an upward-facing function and below the vertex in a downward-facing function.

Vertex

The vertex is the highest or lowest point (depending on the direction). It is a fixed point.

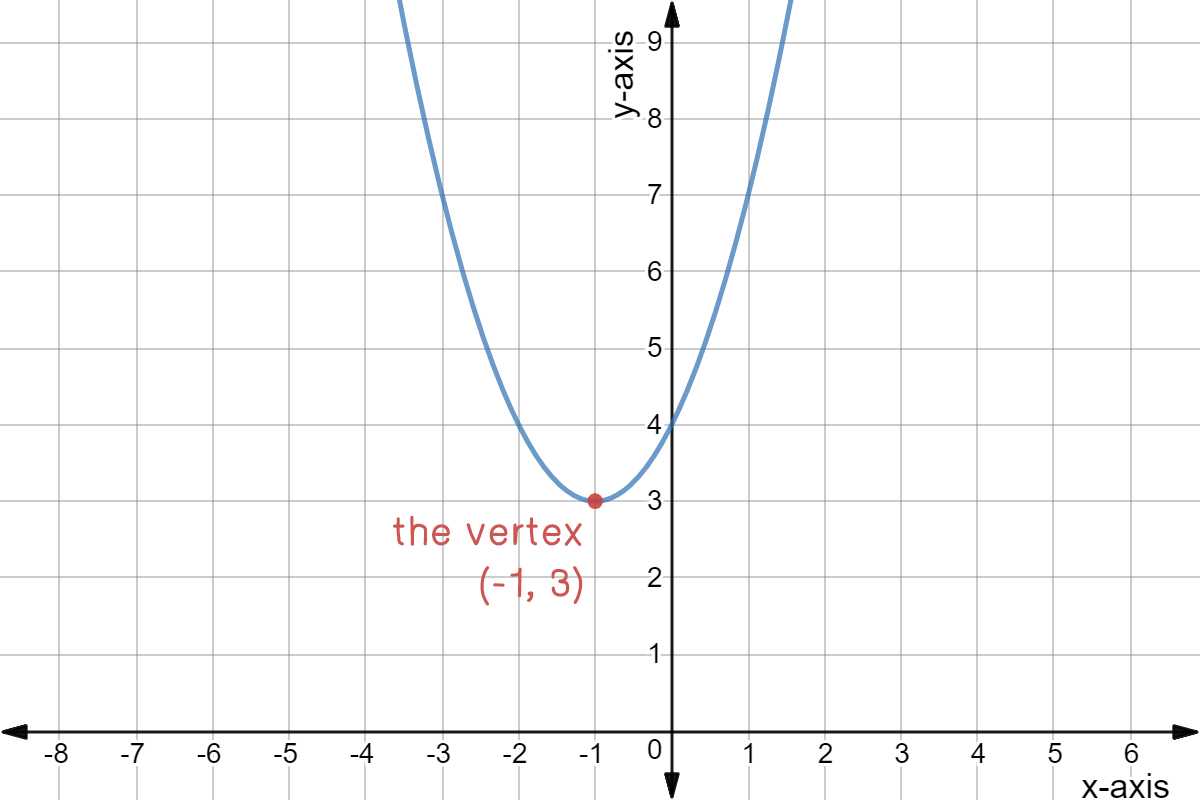
For example, the parabola below faces up and has a lowest point. The vertex of this parabola is (−1,3)(-1, 3).

Quadratic graph of y = (x + 1)^2 + 3.

Made using Desmos

When written in vertex form, y=a(x−h)2+ky=a(x-h)^2+k the vertex is simply (h,k)(h,k).

If we have the equation in the form of y=ax2+bx+cy=ax^2+bx+c we can calculate the xx-value for the vertex, namely hh, very easily: h=−b2ah=\frac{-b}{2a} To find kk, or the yy-value of the vertex, simply plug this xx-value in the quadratic function and solve for y.y.

Axis of Symmetry

All parabola are symmetrical. The axis of symmetry goes through the vertex of that parabola, is perpendicular to the xx-axis, and is parallel to the yy-axis.

For example, the axis of symmetry for the parabola below is x=−1x=-1.

Same graph as above but with a line at x=-1.

Made using Desmos

Zeros

The zeros (also called roots or solutions) of a parabola are the xx-intercepts: where the parabola touches the xx-axis! To calculate the zeros from a quadratic function, let yy be 00 and find xx.

Quadratic graph of y = (x+2)(x-3). The roots (-2,0) and (3,0) are highlighted.

Made using Desmos

Of course, when the function is written in xx-intercept form y=a(x−p)(x−q)y=a(x-p)(x-q) the zeros are (p,0)(p, 0) and (q,0)(q, 0).

Parabolas can have zero, one, or two distinct xx-intercepts.

If we want to double check how many zeroes our function has, we can use the discriminant.

Quadratic graph of y = x^2.

Parabola with one x-intercept/zero.

Made using Desmos

Quadratic graph of y = x^2 + 1.

Parabola with no xx-intercept/zero.

Made using Desmos

Type a concept, like “slope” or “photosynthesis”.

↑ ↓ to choose · Enter to openSearch explanations and problems