
Interactive · 2 questions
Does have a limit as ?
Hint: Try plugging in smaller and smaller values like , , , etc. What do you find?
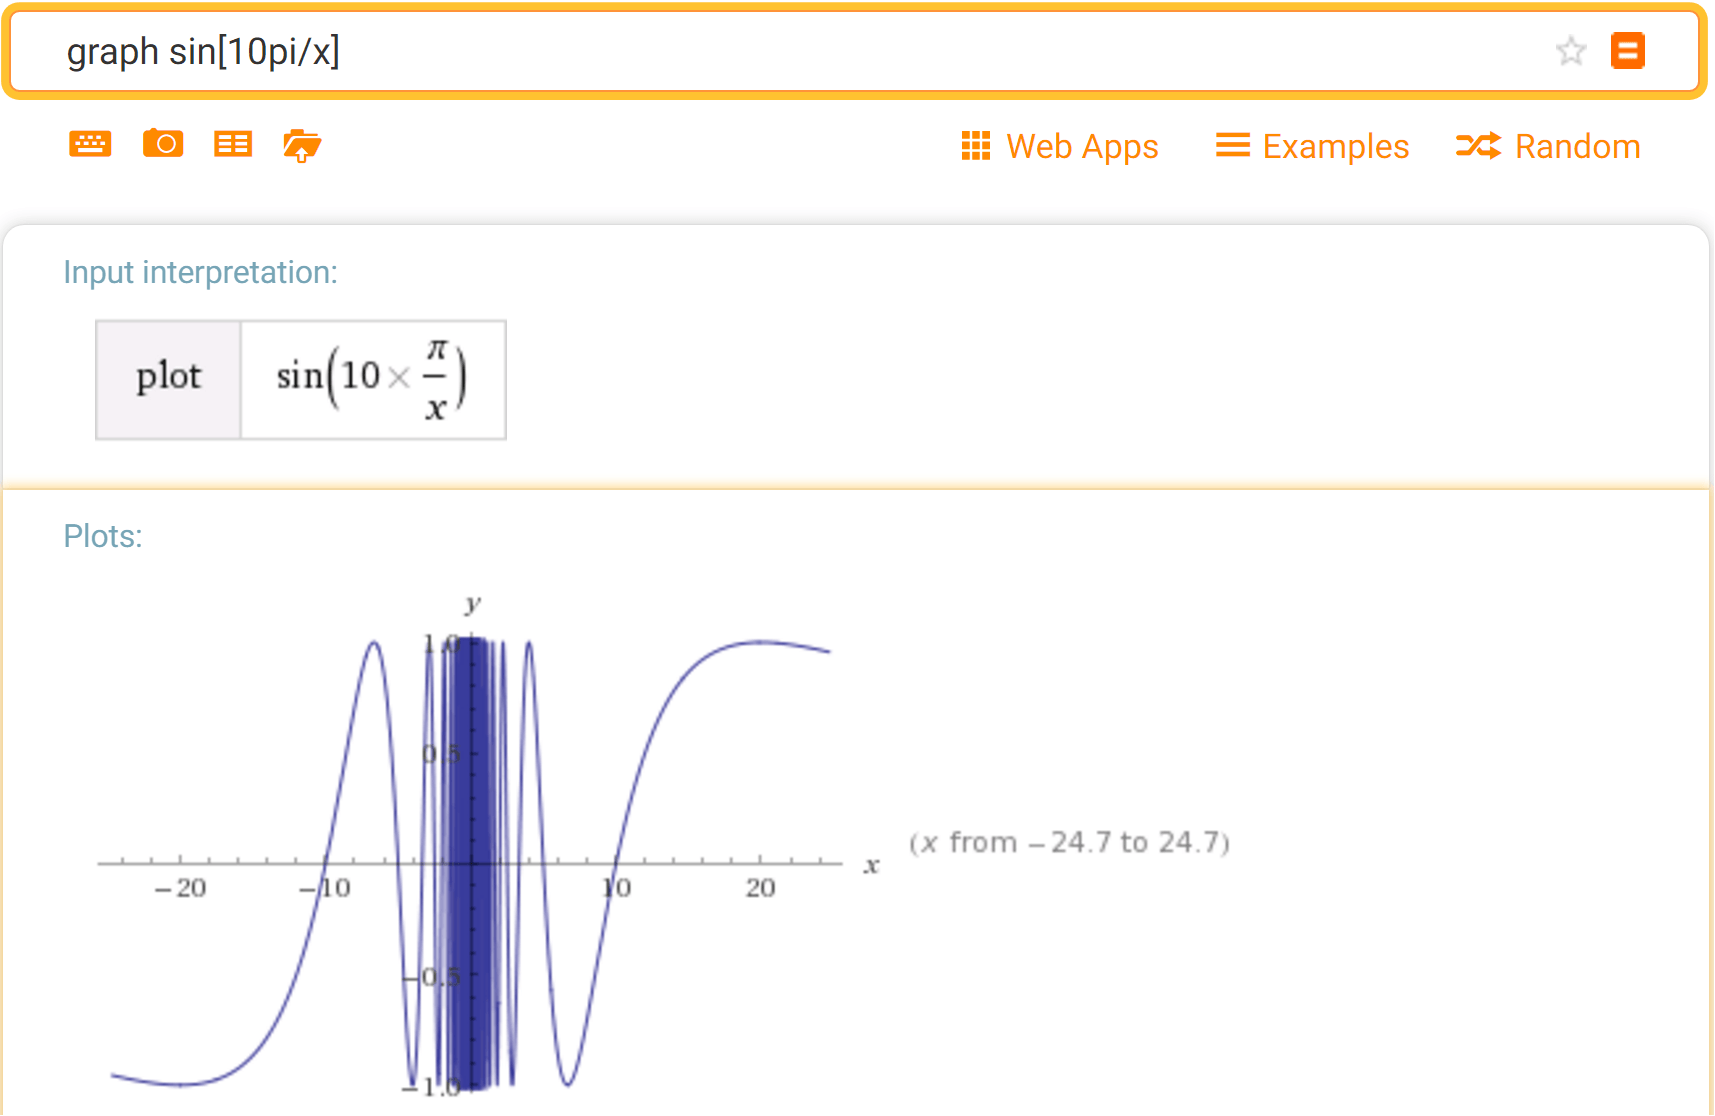
Here's a graph to visualize what's going on as gets smaller and smaller:
Actually, when is too small, the graph pictured above is no longer accurate---the function oscillates too wildly!
Give your best guess: Why is the graph inaccurate for small values of ?
Great. If you want a more accurate, high-resolution, graph of this wildly oscillating function, try http://www.wolframalpha.com/input/?i=graph+sin[10pi%2Fx]
If you're interested, the graph is closely related to something known as the topologist's sine curve.