Gráfico de uma função

Illustrated · 1 min

Square Root Graph

We've seen how to graph different functions, like a linear function and a quadratic function. Most of these types of standard functions have parent graphs, which are basically graphs of the basic function. For example, we know that the parent function of a linear equation is y=xy=x, where the line goes through the origin, (0,0), and has a slope of 11. In this lesson, we will explore the parent function of another type of equation: the square root equation.

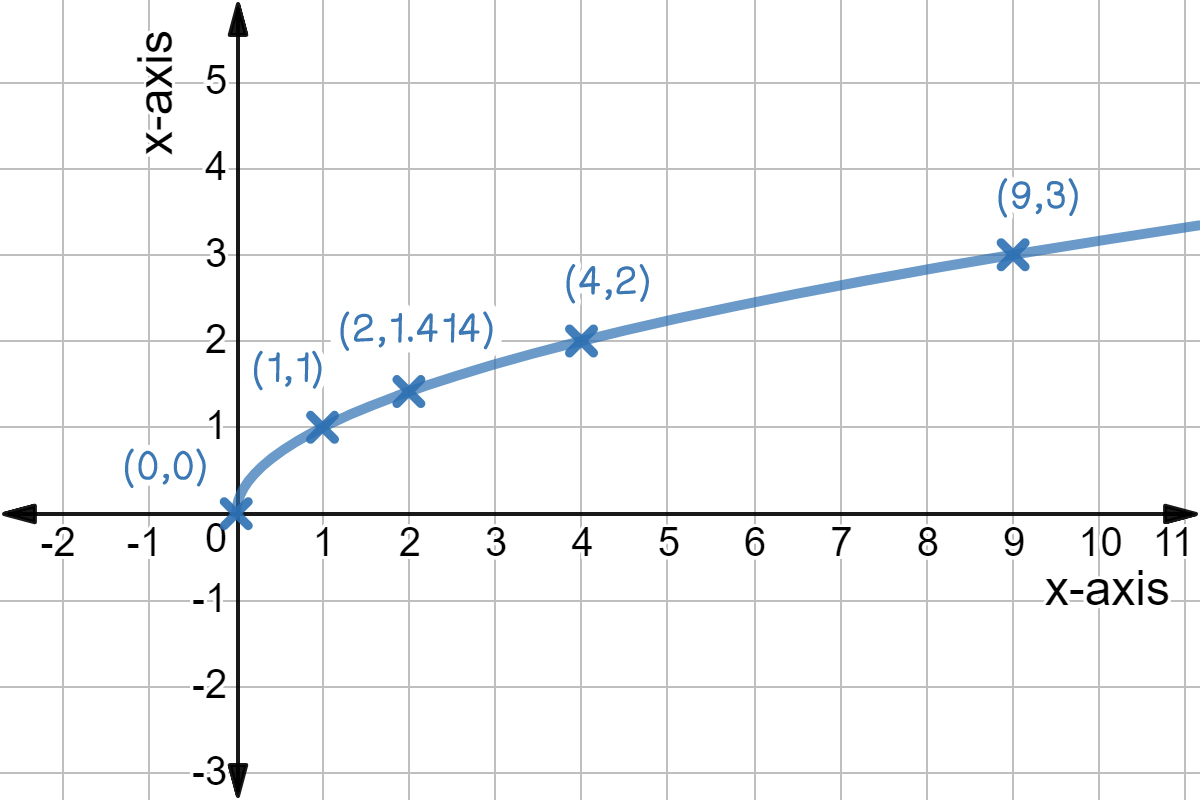
The base square root graph is: y=xy=\sqrt x.

Radical graph y = sqrt(x).

Made with Desmos

Notice it starts at the point (0,0)(0,0) and goes through the point (1,1)(1,1). The xx value continues to increase, and the yy value will plateau and increase infinitesimally.

Stretch and Shrink

Like other parent functions, we can also stretch or shrink the graph: y=axy=a\sqrt x

  • If aa is greater than 11 (a>1a>1) the graph gets stretched.
  • If aa is between 00 and 11 (0<a<10<a<1) the graph gets shrunk.
The square root stretch y = 2sqrt(x) and the square root shrink y = 0.5sqrt(x)

Made with Desmos

You can also shift the graph to the left, right, up, and down. The best way to graph a square root function is to create a table of values, calculate coordinates, and plot a few points! Then, you can follow the points because you know what the general patten will be.

We can use this basis to solve word problems with radical equations!

Video

(Video) Graphing the Square Root Function

by mathman1024

This video by mathman1024 explains graphing square root functions.

Summary\large{\text{Summary}}

f(x)=xf(x)=\sqrt{x}

If we draw a t-table of values we get xy−1NA001121.414...4293\begin{array}{c|c} x&y\\ \hline -1&\text{NA}\\ 0&0\\ 1&1\\ 2&1.414...\\ 4&2\\ 9&3 \end{array}

(Remember, you can't take the square root of a negative number.)

So now we plot these point on our graph.

Graph of points (0,0), (1,1), (2,1.414), (4,2), and (9,3).

Made with Desmos

Now we we connect these points we get the graph of the square root function!

Graph of points (0,0), (1,1) (2,1.414), (4,2), (9,3) with a square root function passing through all points.

Made with Desmos

As you can see the graph is only the positive xx and yy values. So we can define our domain and range as: D=[0,∞)R=[0,∞)D=[0,\infty)\\ R=[0,\infty)

Illustrated · 1 min

Graphing Square Root Functions

Square root functions, y=xy=\sqrt{x}, are very straightforward. Check out this graphic to understand what they look like and the key points to graphing square root functions.

Graphing Square Root Functions
Key points:
-Starts at origin (0,0)
-Goes through the point (1,1)
-Goes on until infinity

Image source: by Anusha Rahman

These key points will stand true for all parent square root functions that take the form: y=xy=\sqrt{x}.

You can also shrink or stretch a square root function!

y=axy=a \sqrt{x}

,where aa can take any numerical value.

Type a concept, like “slope” or “photosynthesis”.

↑ ↓ to choose · Enter to openSearch explanations and problems