Логарифми: графіки та властивості

Before this, knowЯка дія обернена до піднесення до степеня?

Illustrated · 1 min

How to find the equation of a log graph

So we know how to take an equation and transform it into a graph. Now let's think about the other direction.
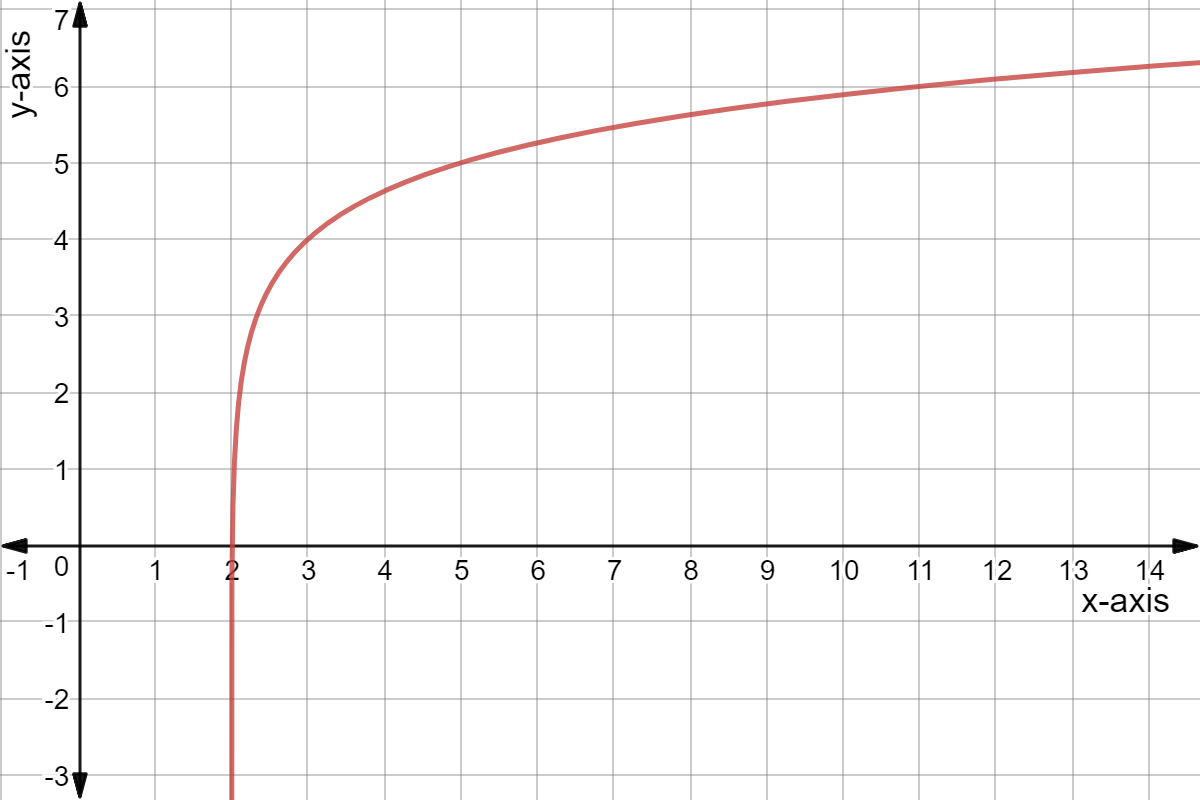
A logarithmic function.

Graph created with Desmos

Let's try to find the equation of this graph! The only additional information we get is that the base of the logarithm is 33.

We can start by writing down all the information that we can use from the graph:

  • The base is 33.
  • There is a vertical asymptote at x=0x=0.
  • The function goes through the points (3,4)(3, 4), (5,5)(5,5), and (11,6)(11,6).

Next, we know that a general formula for this graph should look like: y=log⁡b(x+a)+c\boxed{\color{purple}{y=\log_b(x+a)+c}} We're given that b=3b=3, but we still need to figure out aa and cc.

We can figure out aa by reasoning about properties of logarithms. We know that log functions are only defined for positive numbers; this means that x+a>0x+a>0 in our function.

Since we have an asymptote at x=2x=2, we know that x>2x>2 (or equivalently, x−2>0x-2>0).

We can combine x+a>0x+a>0 and x−2>0x-2>0 to get: a=−2a=-2 So now our function looks like this: y=log⁡3(x−2)+c\boxed{\color{purple}{y=\log_3(x-2)+c}}

Finally, we can figure out cc by plugging in points into our function! Let's try it with (3,4)(3,4): y=log⁡3(x−2)+cy=\log_3(x-2)+c 4=log⁡3(3−2)+c4=\log_3(3-2)+c 4=log⁡3(1)+c4=\log_3(1)+c c=4c=4

And we have our function! y=log⁡3(x−2)+4\boxed{\color{purple}{y=\log_3(x-2)+4}}

Video

(Video) Expanding Using the Properties of Logarithms

by The Math Sorcerer

This video by The Math Sorcerer provides an example of condensing logarithmic expressions.

Illustrated · 1 min

Asymptotes of Logarithms

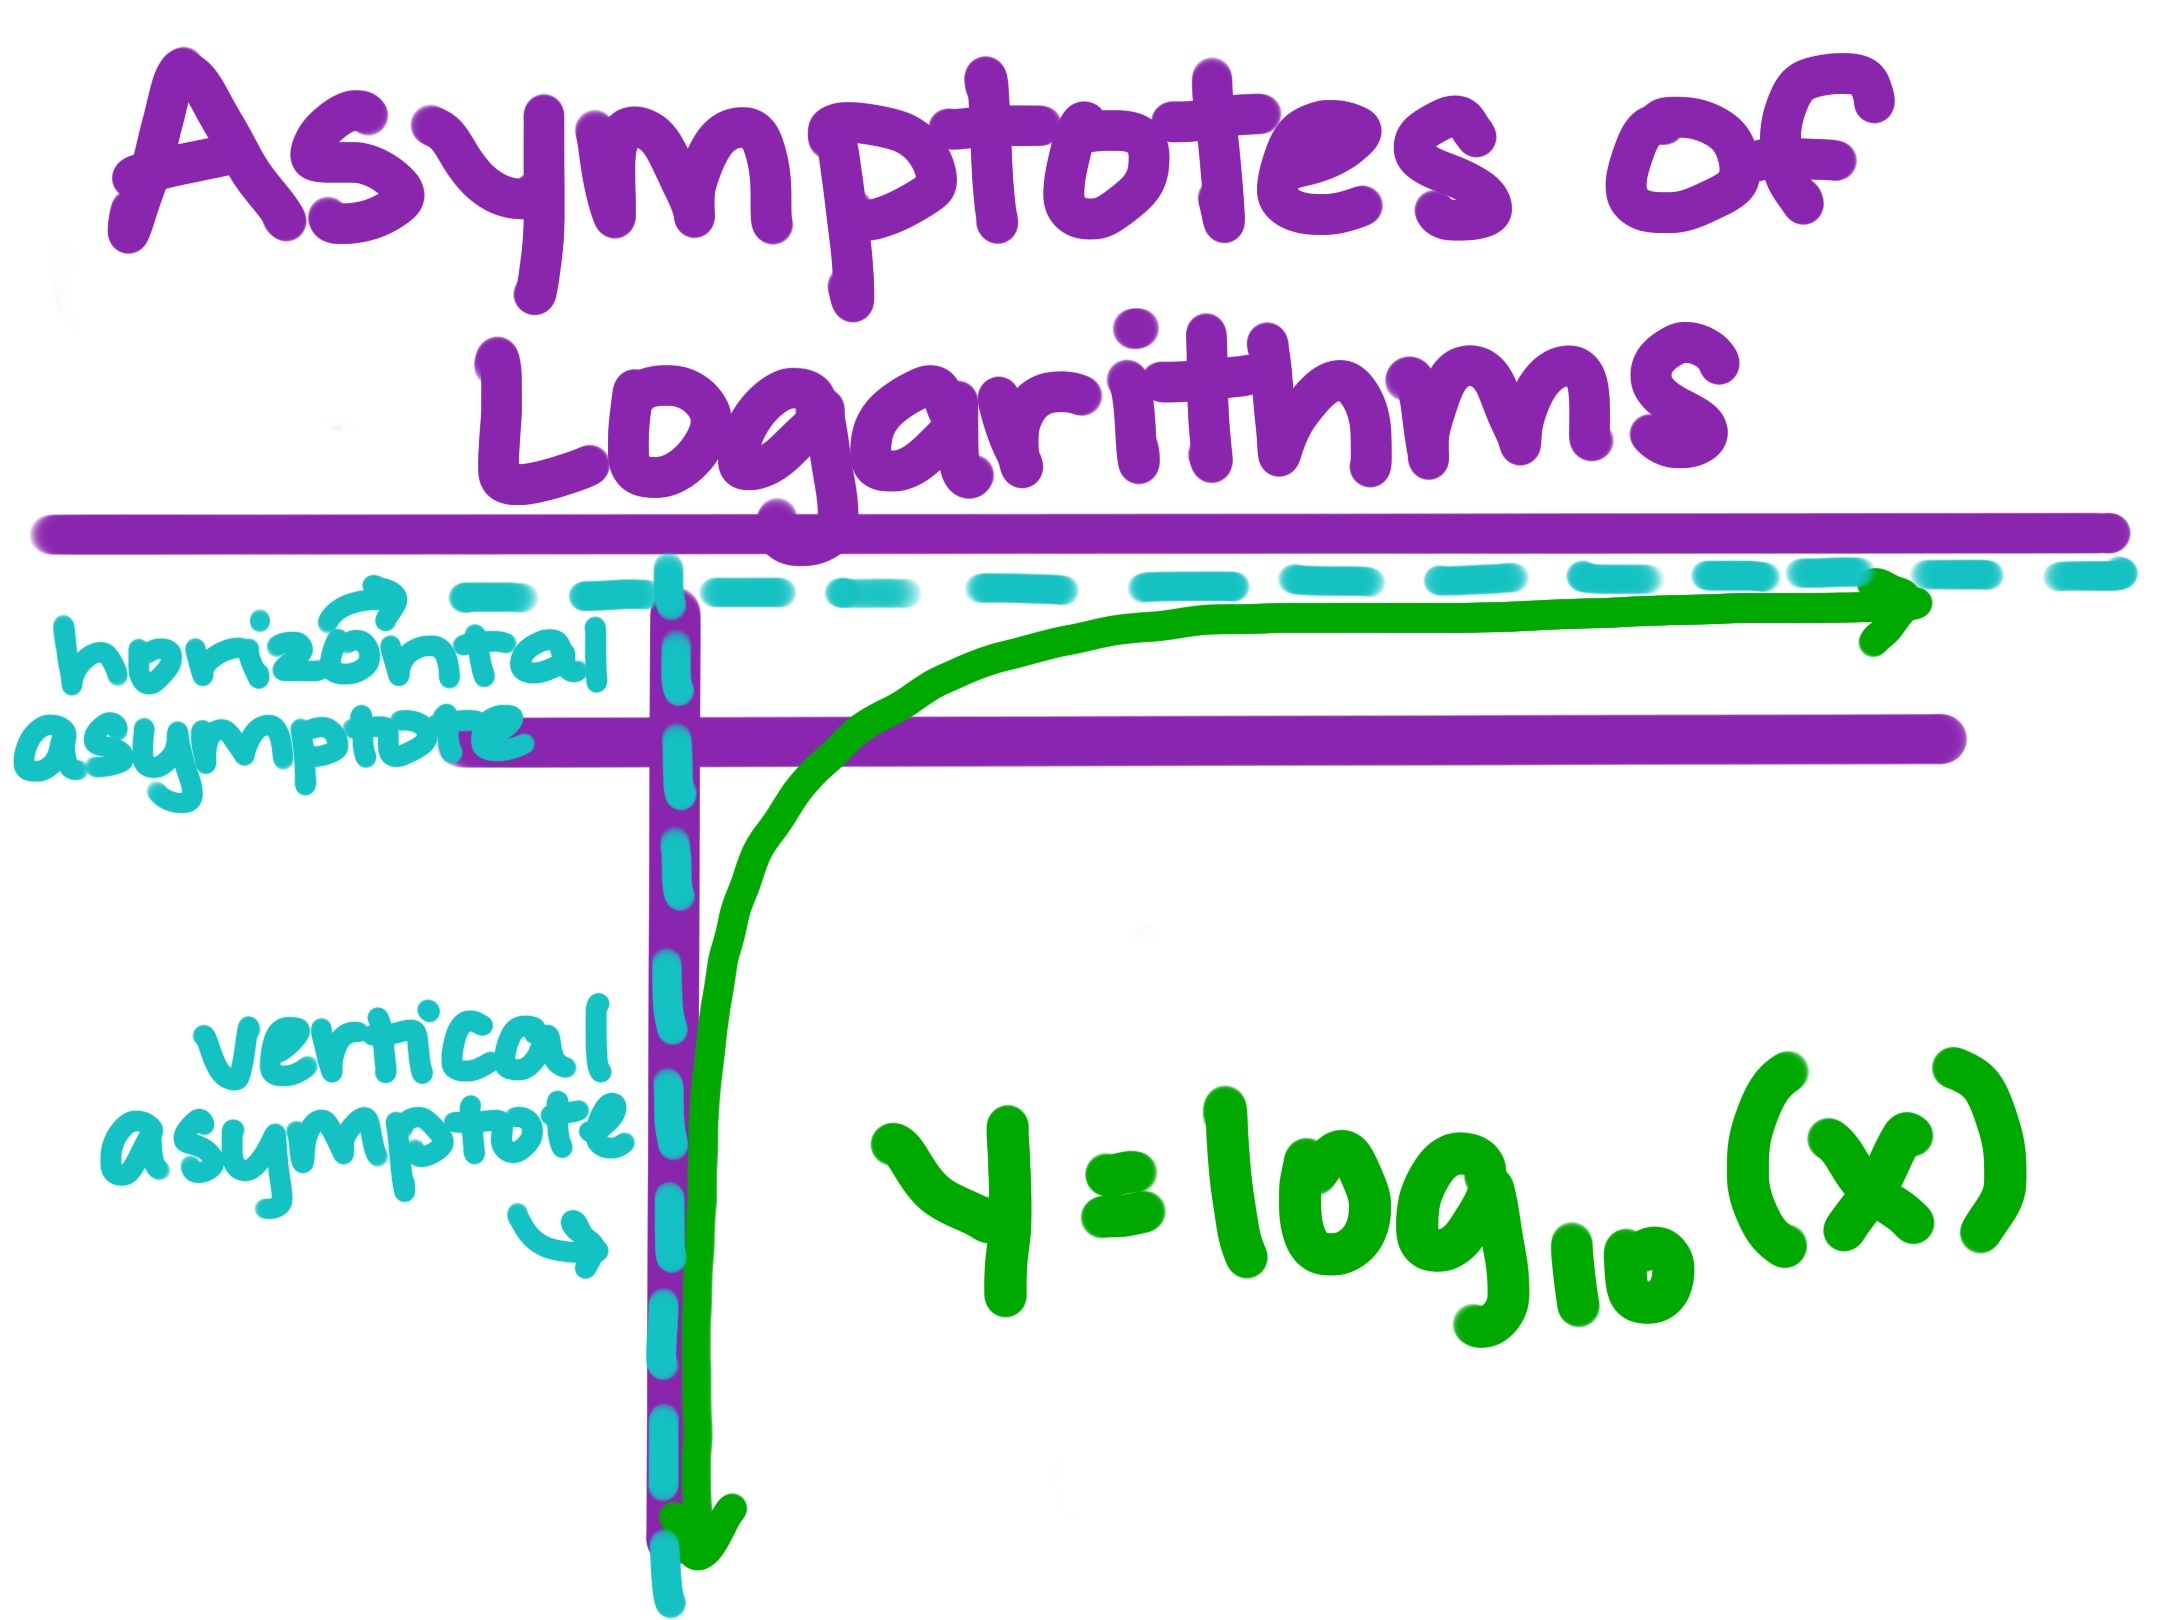
Before we learn about how to graph logarithmic functions, we should first understand the asymptotes of logarithmic functions.

Asymptotes of Logarithsm
y=log_10(x)

Image source: by Anusha Rahman

When you graph a logarithmic function, the curve approaches a line but never touches it. This line is called the asymptote. For logarithmic functions, the asymptote is vertical, not horizontal. This is different from exponential functions, which have horizontal asymptotes.

The basic logarithmic equation looks like: y=log⁡b(x)y=\log_b(x)

In this function, the vertical asymptote is: x=0x=0

This means that the graph gets closer and closer to the yy-axis but never crosses it. You can't take the log of 00 or a negative number, so logarithms are only defined for positive real numbers. That means that the graph always stays to the right of the yy-axis.

The asymptote of a logarithmic function helps you understand where the graph starts and how it behaves. It’s a boundary the graph will never cross. Knowing where that boundary is helps you graph and interpret logarithmic functions correctly.

Type a concept, like “slope” or “photosynthesis”.

↑ ↓ to choose · Enter to openSearch explanations and problems