Interactive · 4 questions
+6 contributors





Inequalities can have more than one variable. Here, we're going to take a closer look at inequalities that have two variables, and .
When inequalities involve curves instead of lines, the process extends to graphing systems of nonlinear inequalities. We will learn about that in later lessons.
When you've got an inequality with more than one variable, the solutions you find will be ranges instead of single values. So, it's common to use graphs to show the range of solutions that solve the inequality.
Here is a graphic of a flowchart to help you better understand these steps:

Image source: Anusha Rahman
Because of this, you will need to get your inequalities into slope intercept form (in other words, , but with an inequality sign instead of an equals sign).
Let's take a look at a few examples, starting with a pretty simple one:
Let's find the slope and -intercept.
The slope of the line is always in , and since there's no obvious answer for here we can conclude that it's .
The -intercept is always in . In this case, that's !
Now we know that our slope is (coefficient of ) and our -intercept is .
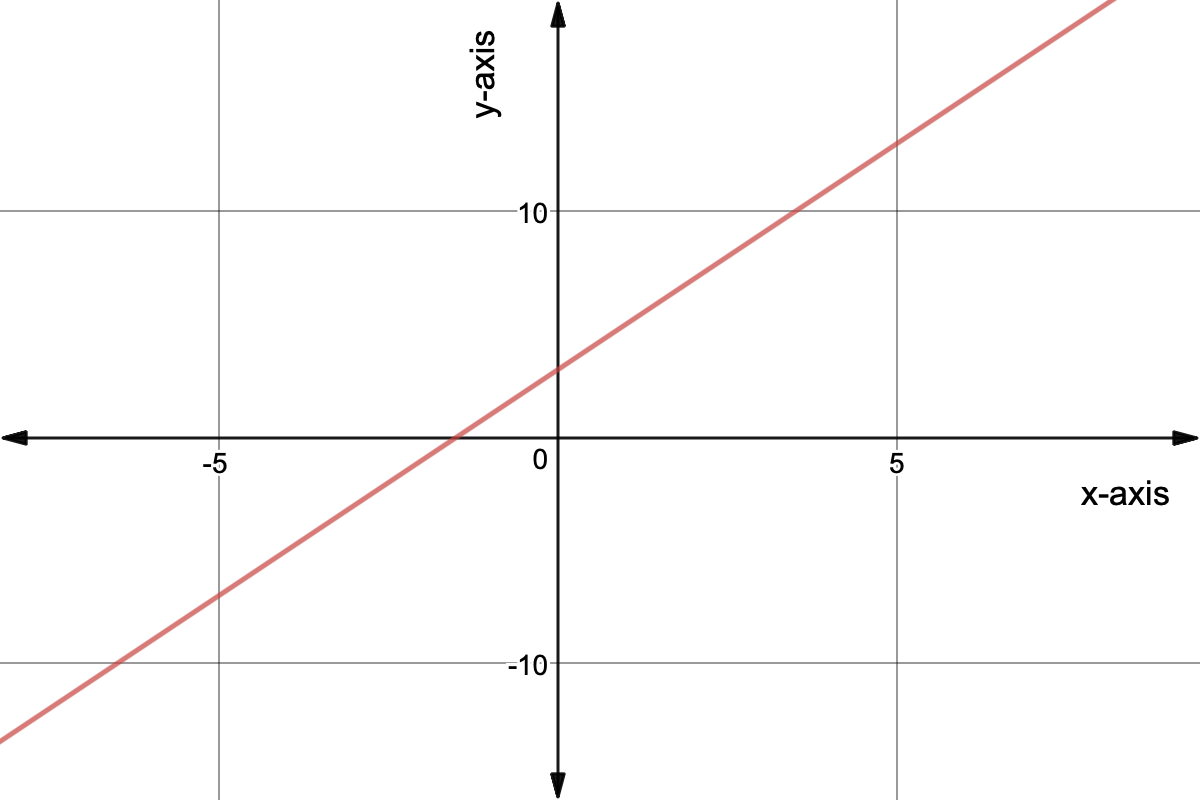
Grab graph paper or a graphing calculator and try graphing this line on a coordinate plane!

Made using Desmos
There are two things we need to do now:
- If the inequality symbol is or , the line needs to be dotted. If the sign is or , the line remains a solid line.
- Shade the area of the graph that shows the range of solutions to the inequality.
Another important note: Even with linear inequalities, it is possible for a system to have no solution when shaded regions do not overlap.
Consider the inequality we used to graph this line:
Should we use a dotted line or a solid line on our graph?
Do you think we should shade the area above the line or the area below it?
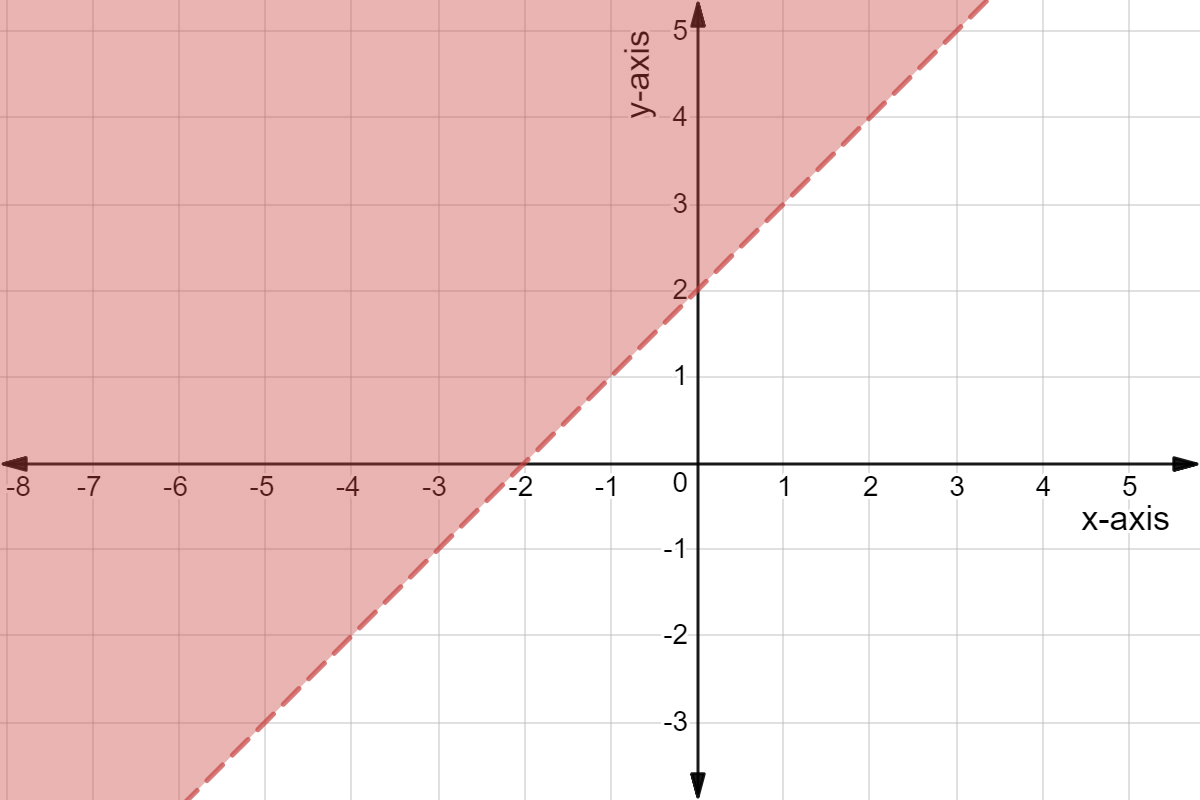
Made using Desmos
Notice how we have a dotted line here because our inequality sign was . The site of the boundary line is basically what we graphed earlier.
Note: if we had a greater than or equal to sign, , then the line would've been solid.
We also shaded the graph to show the range of solutions that make our inequality true. Recall that our inequality tells us that .
This means that y is greater than the corresponding value plus . For instance, let's say that . This means that is greater than when . Check the graph - the solution to the inequality, i.e., the values that satisfy the inequality, is the shaded area.
Let's look at another example:
First, we need to get this inequality into slope intercept form.
Now we need to graph this line.
Will the line be dotted or solid?
Will we shade below the line or above it?
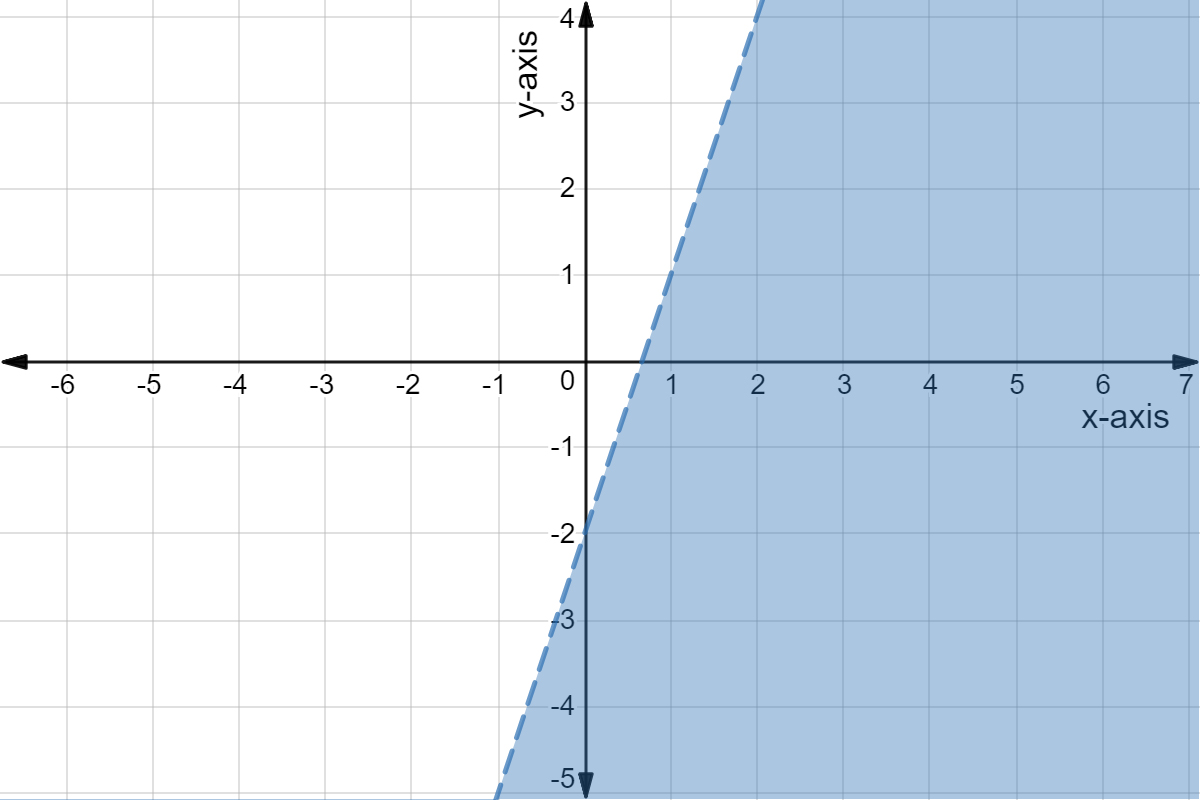
Made using Desmos
Because we have in our inequality (instead of or ) our line will be dotted.