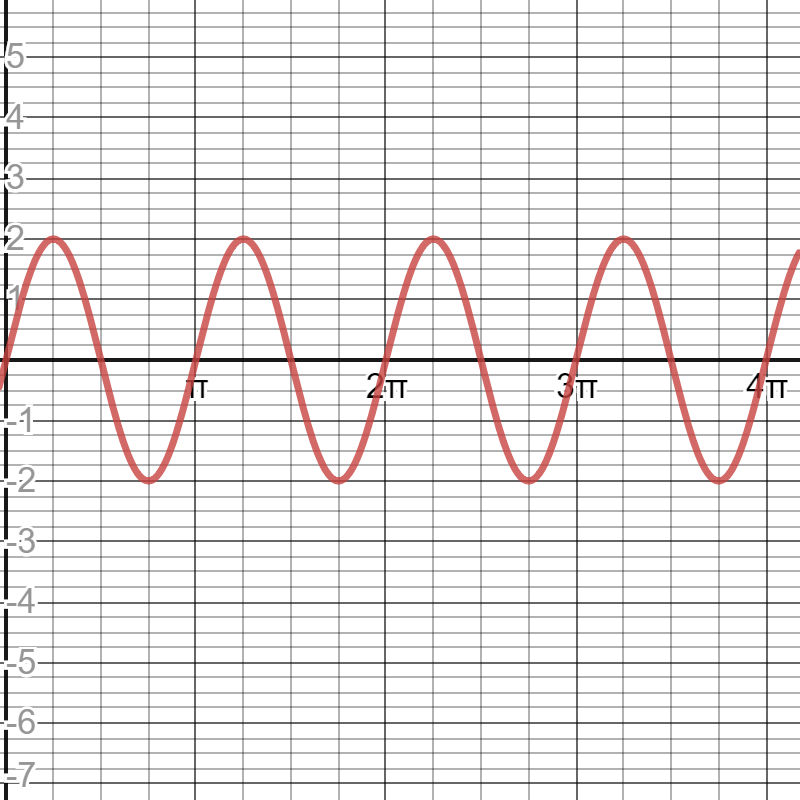
Графік синуса

Before this, knowВластивості синуса

Interactive · 1 question

How to Graph a Sine Function

A graph showing one period of sine

Image by Geek3 via Wikimedia Commons

The graph above shows one period of a sine wave. We know that the period is equal to 2π2\pi, since the sine wave will repeat every 2π2\pi units.

A graph of a longer sine wave with the amplitude and wavelength  labeled

Image by Kraaiennest via Wikimedia Commons

Above, we have a sine wave that extends further than 2π2\pi. We also have a few more identifiers we need to define.

λ\lambda: Pronounced "lam-duh": This is the wavelength of the sine wave. This is the distance between each crest (or tip) of the wave.

AA: Amplitude: This is the height of each wave. More technically, it is the measure of deviation from its central value. This value is always positive.

Let's take a look at how we can affect our AA and λ\lambda values!

Graph of a sine wave

Made using Desmos

Pictured above, we have a typical sine wave. This would be written as f(t)=sin⁡(t)f(t) = \sin(t). I used f(t)f(t) because sine is a function of some number tt. Now, let's see what happens if we make it f(t)=2sin⁡(t)f(t) = 2\sin(t).

Graph of f(t) = 2 sin(t).  This doubled the amplitude of our original wave

Made using Desmos

Notice the change in our AA (amplitude) value! By putting a value in front of the sin⁡\sin, we changed the graph by that factor (i.e. multiplied 1×21 \times 2 to get the new amplitude)

What is the amplitude of f(t)=3sin⁡(t)f(t) = 3 \sin(t)?

Choose one answer

Video · + 1 min read

Graphing Sine Functions

by Brian McLogan

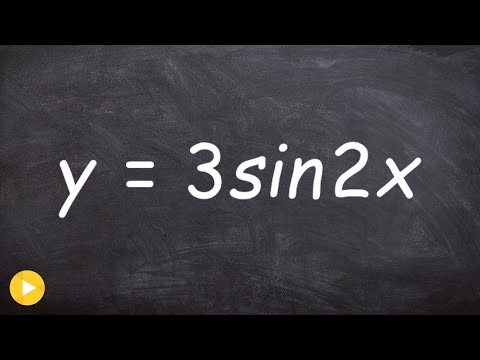
In this video by Brian McLogan, you will learn how to use the period and amplitude to graph a sine function.

Summary

Before we can graph a sine function, we first need to review how to find the amplitude and the period. Remember that the general form of a sine function is: y=asin(bx−c)+dy=asin(bx-c)+d

Amplitude =∣a∣=∣3∣=3= |a|=|3|=3

That means that the height of our graph, from the midline to the maximum or minimum, is 33.

Period =2πb=2π2=π=\frac{2\pi}{b} = \frac{2\pi}{2} = \pi

The period tells us how long it takes for the function to make one cycle. The period of this function is π\pi. That tells us that our sine graph starts at the origin, like normal, but its first cycle will end at π\pi.

Using this information, we can determine that our graph looks like:

Graph of y=3sin(2x)

Made using Desmos

Since this is a sine function, which is periodic, the cycle will go on forever. The above graph only shows the first cycle, but you can repeat this pattern until positive and negative infinity.

Illustrated · 1 min

Sine Function Graphs

When graphing the parent sine function, there are a few key points to keep in mind that will make it easier to graph! This is called a sinusoidal function.

Sine Graphs

Image source: by Anusha Rahman

We've previously seen the sine graph visually, on the unit circle. This time, we are graphing the sine function on our typical coordinate plane with real numbers. The sine function is an odd function, and the cosine function is an even function.

Graph Description

The peak is the highest point of a periodic function, and the trough is the lowest point.

For a parent sine graph,

  • The amplitude (the distance from the midline to the trough/peak) is 11.

  • The period is 2π2\pi.

  • The xx-intercepts are π\pi and 2π2\pi.

  • The yy-intercept is at the origin.

The maximum and minimum are the peak and trough, respectively.

Transformations

We can also apply transformations to the sine graph! These transformations apply to sine or cosine graphs.

  • Phase shift: a horizontal translation

  • Vertical shift: a vertical translation

Type a concept, like “slope” or “photosynthesis”.

↑ ↓ to choose · Enter to openSearch explanations and problems