Video · + 1 min read

(Video) Graphing Piecewise Defined Functions

by mathman1024

Here's a video by mathman1024 showing you how to graph piecewise functions. A piecewise function is made up of different pieces (crazy isn't it). Each piece tells you what to graph and on what interval to graph. Normally, we didn't have an interval when graphing, we would just have it continue on forever. For piecewise you have to stick to the interval otherwise the graph fails the vertical line test and isn't a function anymore.

In the video he looks at the piecewise function f(x)={x+2,x<1−12x+1,x≥1f(x)=\begin{cases}x+2,&x<1\\-\frac12x+1,&x\ge1\end{cases}. As you can see there's two different pieces to this graph. At the point x=1x=1 the function changes from x+2x+2 to −12x+1-\frac12x+1.

Let's begin by looking at the first piece: f(x)=x+2f(x)=x+2. This graph has a slope of m=1m=1 and a y-intercept at (0,2)(0,2). If we were to graph this normally, we'd get:

Graph of y=x+2

Made using Desmos

But remember, this piece is only on the interval x<1x<1. So the piecewise function takes the form y=x+2y=x+2 as long as xx is less than one.

Graph of y=x+2, where x<1

Made using Desmos

We put an open circle at the end because this part of the graph does not include the point at x=1x=1. Next let's look at the second piece: f(x)=−12x+1f(x)=-\frac12x+1. Here we have another line with a slope of m=−12m=-\frac12 and a y-intercept at (0,1)(0,1). It's graph would look like:

Graph of y=-(1/2)x +1

Made using Desmos

But remember that this second piece is on the interval x≥1x\ge1. So, when the piecewise function is at x=1x=1 or above it takes the form y=−12x+1y=-\frac12x+1.

y=-(1/2)x +1, where x (greater than/equal to) 1

Made using Desmos

Since the interval contains the point at x=1x=1 we do not need an open circle and instead have a closed one. The final step is to combine these graphs together to make the entire piecewise function.

Both graphs combined

Made using Desmos

Test Yourself: Graph the piecewise function f(x)={3x−1x≤0−x+1x>0f(x)=\begin{cases}3x-1&x\le0\\-x+1&x>0\end{cases}.

Graph

Made using Desmos

Illustrated · 1 min

Now that we know what piecewise functions are, we can learn how to graph the function!

In essence, what you're going to do is graph the individual pieces of the function based on the corresponding domain or interval of each piece of the function. This concept is for real numbers. This process is similar to what we did for parent functions.

The best way to learn this concept is to walk through an example!

Example: Graph the following piecewise function.

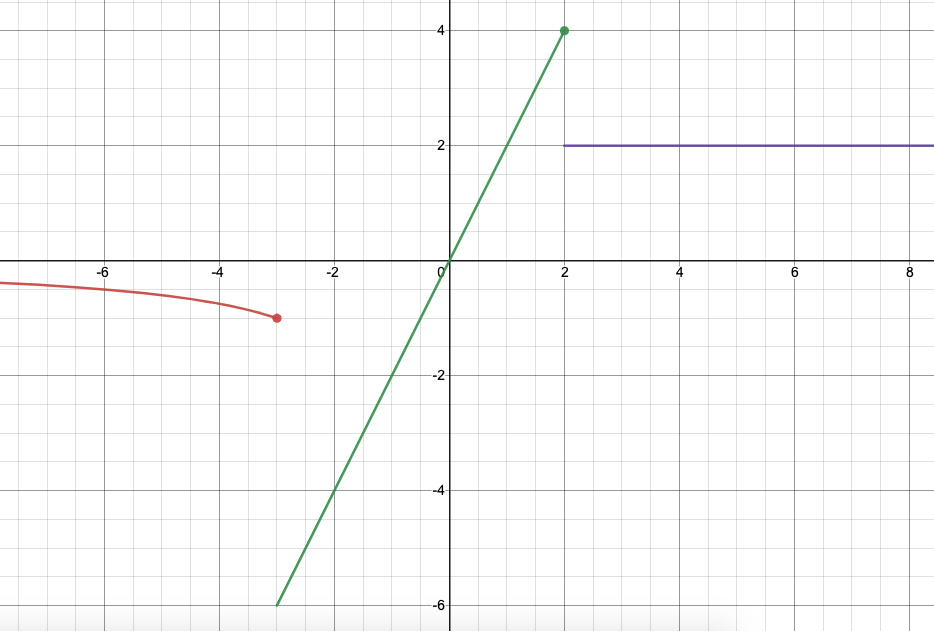
{3xx≤−32x−3<x≤22x>2\begin{cases} \frac{3}{x} & x \leq -3 \\ 2x & -3<x \leq 2 \\ 2 & x>2 \\ \end{cases}

We will graph each function within the interval assigned to it. Let's start with graphing y=3xy=\frac{3}{x} within the domain of x≤−3x \leq -3. Using asymptotes will help you graph this function!

Graph of y=3/x, with a solid point at (-3, -1).

Made using Desmos

As you'll notice, we didn't graph the entire function of y=3xy=\frac{3}{x}. We only graphed this function for the domain of x≤−3x \leq -3, including −3-3.

Now that we've graphed the first equation, we can move onto the second equation, y=2xy=2x. This function exists on the interval −3<x≤2-3<x \leq 2. We'll just add this linear equation to our existing graph.

Red graph of y=3/x, with a solid point at (-3, -1), over domain x \leq3.
Green graph of y=2x, with a solid point (2,4), over domain -3<x\leq2.

Made using Desmos

The domain for the second equation includes the point at x=2x=2, so there is a solid dot at the point (2,4)(2,4).

The last equation, or piece, in our piecewise function is over the interval x>2x>2, not inclusive. The equation is y=2y=2. This is a horizontal line.

Red graph of y=3/x, with a solid point at (-3, -1), over domain x \leq3.
Green graph of y=2x, with a solid point (2,4), over domain -3<x\leq2.
Purple graph of y=2, over domain x>3.

Made using Desmos

Let's look back at the original question:

{3xx≤−32x−3<x≤22x>2\begin{cases} \frac{3}{x} & x \leq -3 \\ 2x & -3<x \leq 2 \\ 2 & x>2 \\ \end{cases}

There you have it! When graphing piecewise functions, be careful of the individual domain intervals for each equation. Graph each piece individually, and be mindful of which points in the domain are included for each equation.

Illustrated · 1 min

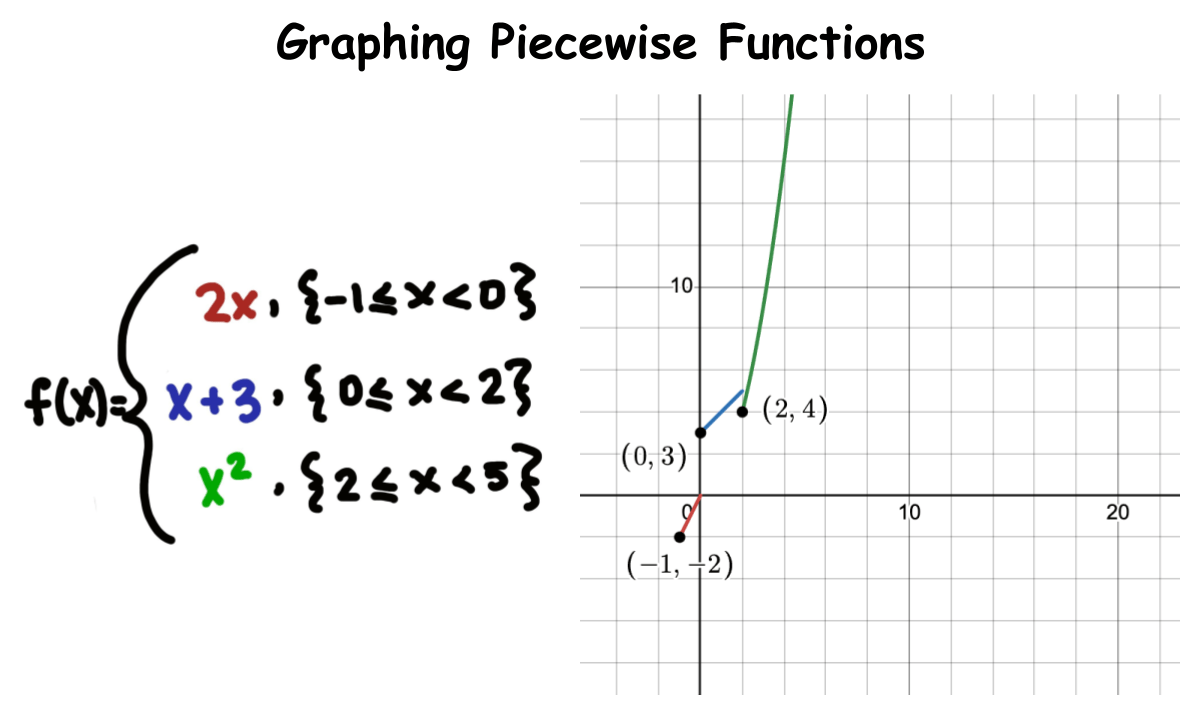
Graphing Piecewise Functions

Now that we've learned the basics of piecewise functions, we can move forward into graphing these special types of functions.

Graphing Piecewise Functions

Made by Desmos

Graphing piecewise functions means plotting different parts of a function on a graph, where each part has its own rule or equation. To graph a piecewise function, you need to look at the different pieces and graph each one separately based on its specific rule.

Pay special attention to the range of values for each piece: these are the xx values where that part of the function is used. Make sure to connect the pieces at the correct points, and sometimes you may need to use open or closed circles to show whether the endpoints are included. After graphing all the pieces, you should have a complete graph that shows the function’s behavior in different sections. Practice helps make graphing piecewise functions easier!

Type a concept, like “slope” or “photosynthesis”.

↑ ↓ to choose · Enter to openSearch explanations and problems