Illustrated · 2 min

Increasing and Decreasing Intervals
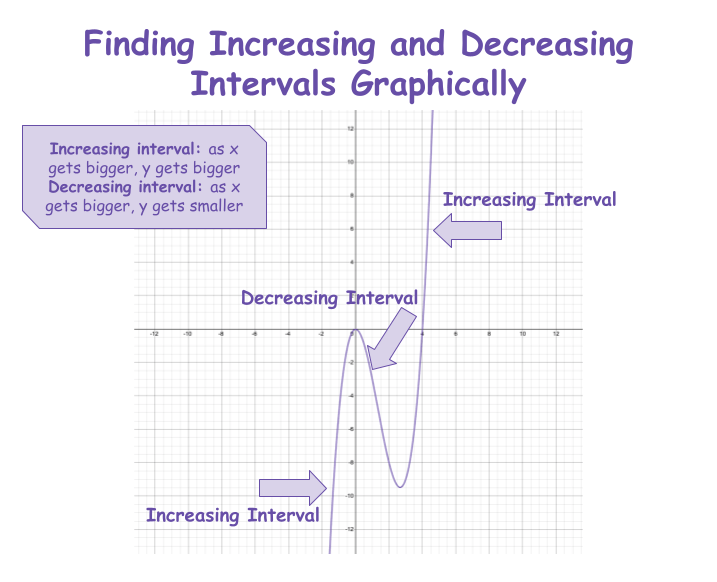
Before we can learn how to find increasing and decreasing intervals graphically, we first have to understand what increasing and decreasing intervals are.
Increasing intervals are when the output increases as the input increases, like a direct relationship. We can more commonly think of this as increasing as increases, or as a positive slope.
Decreasing intervals are when the output decreases as the input increases, like an inverse relationship. We can more commonly think of this as decreasing as increases, or as a negative slope.
As you move forward in math, you will also learn about derivatives and how you can use that to determine whether intervals on a graph are increasing or decreasing.
Finding Increasing and Decreasing Intervals Graphically
Now that we know what increasing and decreasing intervals are, we need to figure out how to find out whether a specific function interval is increasing or decreasing! We previously mentioned that slope and derivatives are two ways to find out. There's a third way -- graphing!
Let's consider the parent function of the quadratic.

Made using Desmos
The graph of this quadratic function has two different colors -- purple and green -- splitting the quadratic in half. The purple part on the left represents the decreasing interval, because as the value increases, the value decreases, until the function meets the origin. This is strictly decreasing. At the point where the function meets the origin (a relative extrema or point of inflection), the function then transitions to an increasing interval, because as the value increases, so does the value. This is strictly increasing.
So, the interval of is a decreasing interval, and the interval of is an increasing interval.
Let's talk through how we figured this out. We looked at the graph and approximated. This method of determining whether an interval is increasing is not very mathematically precise, but it serves out purpose.