Interactive · 1 question
+1 contributors

In a topic as vast as statistics, we have learned so much from box and whisker plots to standard deviation to probability. Now, we will put together some of the concepts we have learned recently as we learn about z-scores.
##z-score
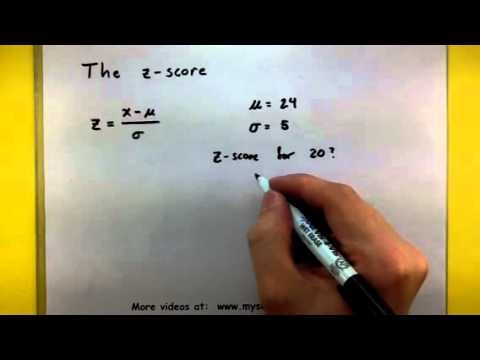
A z-score is a way of understanding where a data point lies in relation to the mean. In reference to the normal distribution, z-scores tell us how many standard deviations away a data point is from the mean.
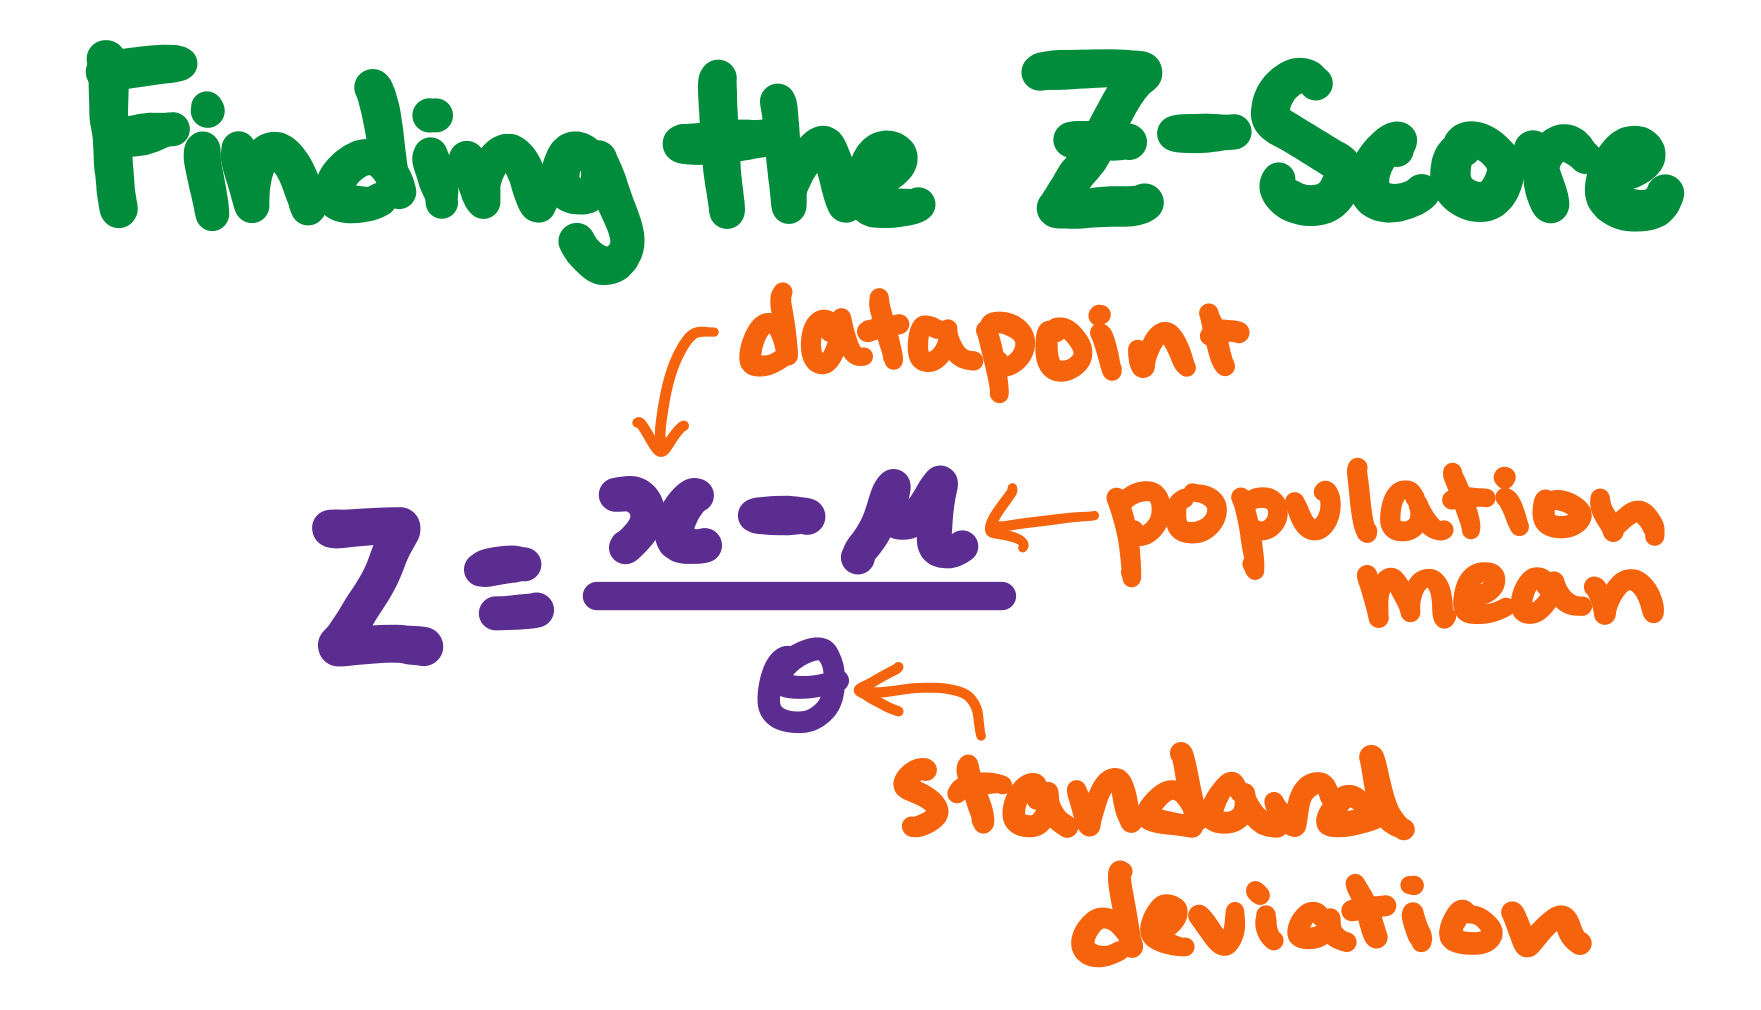
There is a formula we can use to calculate the z-score:
Where...
x = the datapoint
= the population mean
= the standard deviation
Let's walk through an example of how to calculate a z-score.
Fiona just ran a 7 minute mile. She is trying to figure out how this time fits in with her other mile times. Her average mile time is 6.5 minutes with a standard deviation of 2. What is the z-score of her recent mile time?
We are given the mean and standard deviation, so we can solve using the z-score equation.
Therefore, we can say that Fiona's 7 minute mile time is 0.25 standard deviations away from the mean.
Try an example on your own!
Jay recently went to the doctor's office and learned he was 172cm tall. He wanted to know how he fit in with other 13 year old boys in the world. The average 13 year old is 156cm tall with a standard deviation of 14cm. What is the z-score of Jay's height?