Interactive · 3 questions
+5 contributors





Graphing Systems of Linear Inequalities
A system of linear inequalities is two or more inequalities that use the same variables with the same values.
The graph of a system of inequalities shows all of the solutions that make both inequalities true.
There are a few things to remember when you are graphing inequalities:
- Get your inequality into slope intercept form (). You can use an equal sign or the given inequality symbol.
- Graph the line. If the inequality uses or , the line should be dotted. If the inequality uses or , the line should be solid. Keep in mind, you want to graph the functions on a coordinate plane, not a number line.
- Shade the portion of the graph that shows the solutions. Use test points to determine which side to shade. The shaded portion will only be on one side of the line.
Let's look at an example:
STEP 1: Get inequalities into slope-intercept form ()
The first inequality in our system is already in slope intercept form.
The second inequality needs to be rearranged slightly to be in slope-intercept form, as it's currently in standard form:
Write the second inequality in slope-intercept form.
Once we rearrange the second inequality, we get: STEP 2: Graph the lines
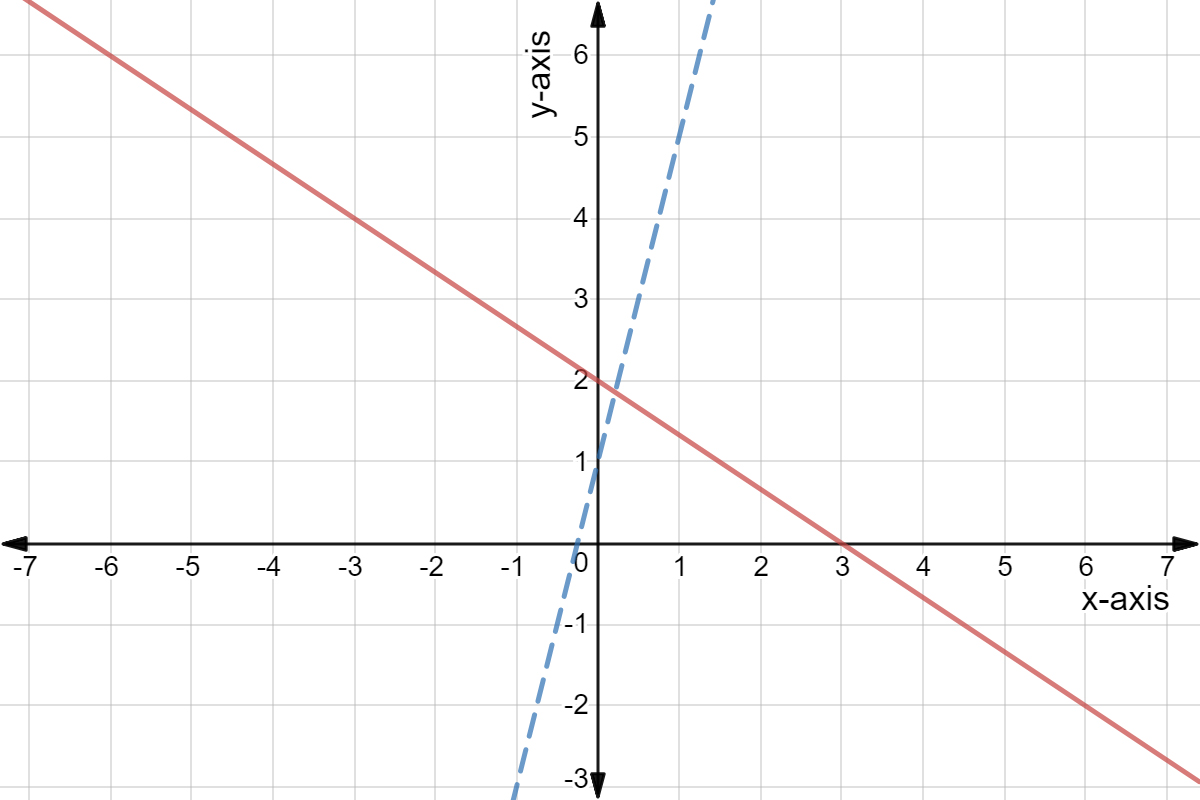
We're going to graph each straight line as if they had an equal sign rather than an inequality.
Made using Desmos
The dotted blue line represents the first inequality in the system and the red line represents the second.
Notice how we're using a dotted line for the first inequality, but a solid line for the second. This is because the first inequality () uses a sign. It is a strict inequality, so the values on the actual line are not solutions to this inequality. The second inequality uses , so the line is solid, and the values on the line are solutions to this inequality.
STEP 3: Shade the portion of the graph to indicate range of solutions
Made using Desmos
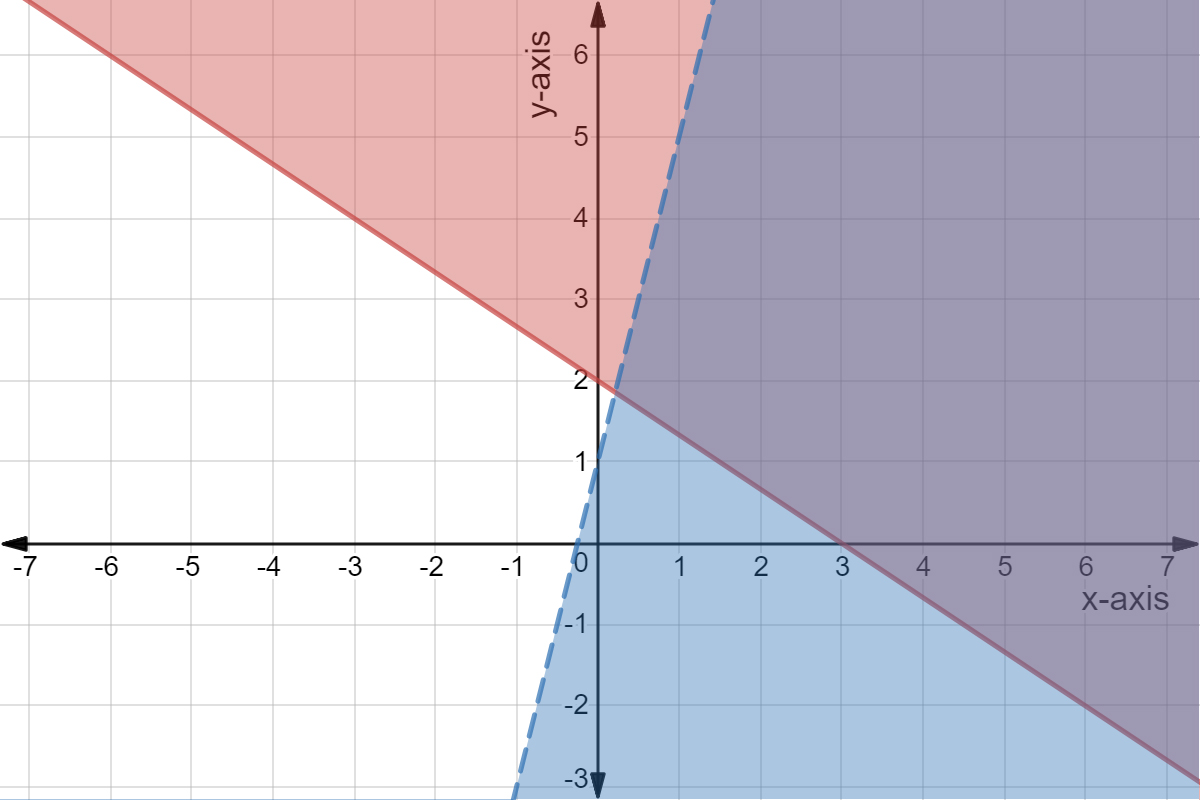
The blue part of the graph shows the possible solutions for the first inequality (). The red part of the graph shows the possible solutions for the second inequality (). The purple area shows where these two colors (ranges of solutions) overlap. The overlapping shaded area is the solution region.
The solutions to the system of inequalities lie in the region where the graphs overlap.
Use test points to determine which side of each line should be shaded. Pick a point on either side of each of your lines, and plug those values into your inequality.
If the inequality is true, then you should shade the side of the line where the test point is. If the inequality is false when you plug in the test point, you should shade the other side of the line.
Let's look at a few examples of these test points.
Take a look at the blue line in the graph. The point is on the left side of the line. Let's plug in to the inequality and see if it produces a true statement:
Is this statement true?
This statement is not true since is not less than . This means that we need to shade the other side of the blue line. (Note that this is, in fact, the area we have shaded blue).
Now take a look at the red line in the graph. The point is located on one side of the line. Let's plug in to the inequality and see if it produces a true statement:
Is this statement true?
This statement is true since is greater than or equal to . This means that we need to shade this side of the red line. (Note that this is the area we have shaded red).
The purple area shows where these two colors (ranges of solutions) overlap. The solutions to the system of inequalities lie in the region where the graphs overlap.
Once you've mastered this section, take it a step further by going from a graph to inequality functions or practicing with word problems!