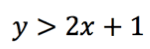
根据图像书写不等式

Before this, know不等式组的图像

Interactive · 2 questions

When writing an inequality from a graph, there are a few things we need to do:

  1. Determine the equation of the line. This gives us the general form of our inequality once we remove the equal sign.

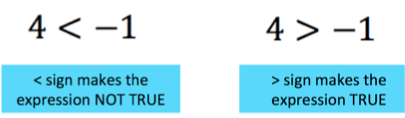
  2. Note whether the line is dotted or solid. Recall that dotted lines indicate << or >> in an inequality and solid lines indicate ≤\le or ≥\ge.

  3. Use the graph's shading to determine which way your inequality sign will face.
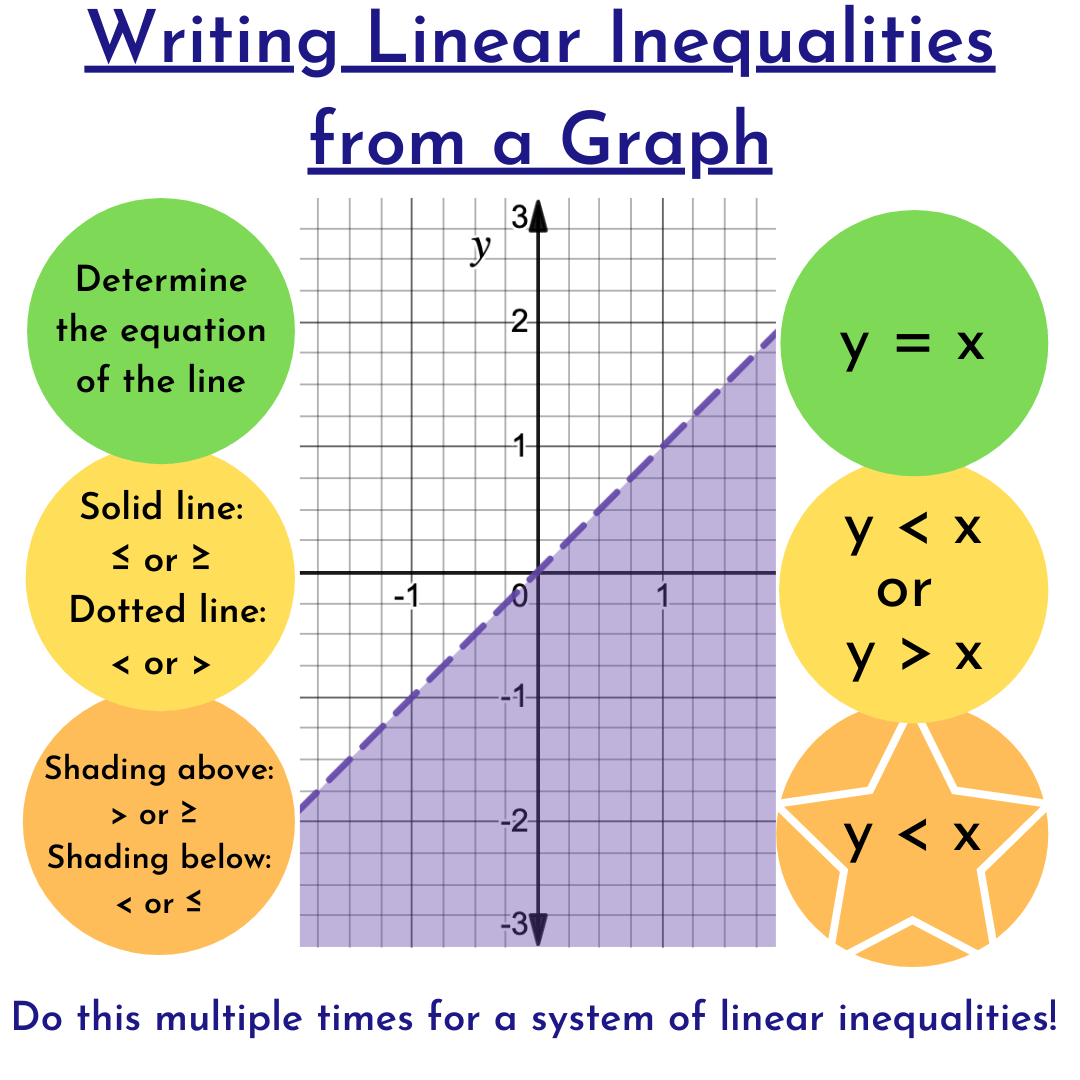
Writing Linear Inequalities from a Graph. There is a graph of y < x in the center of the image. The text in the image shows how to figure out that the inequality represented by the graph is indeed y < x. First is to determine the equation of the line, which is y = x. Next note the line itself (Solid lines: ≤ or ≥ and Dotted lines: < or > line). The line is dotted, so the inequality will be y < x or y > x. Last note the shading (Shading above: > or ≥, and Shading below: < or ≤). The shading is below, so the inequality is y < x.

Image source: By Caroline Kulczycky

This works for single inequalities as well as systems of inequalities. If you have more than one line on the graph, you'll need to use these steps to write more than one inequality.

To go over how to graph inequalities on a coordinate plane, check out this lesson.

Let's look at an example:

A graph of the line y = 2x + 1.  It is depicted on the graph with a dotted line, with everything to the left/above the line is shaded in violet

Made using Desmos

STEP 1: Determine the equation of the line

We can see that the yy-intercept (represented as bb in the equation) of this line (where the line crosses the yy-axis) is:

Choose one answer

Illustrated · 1 min

Writing a System of Linear Inequalities from a Graph

We can graph systems of inequalities to visualize the solutions. We can also look at a graph of a system and reverse engineer the inequalities.

A graph depicting most of the upper right quadrant from 0 to 7 on the x axis, and 0 to 6 on the y axis.  There are two lines.  A red, solid line at x = 1 and then a blue, dotted line at y = 2.  The region that is above both lines is shaded in violet.

Created using Desmos

Take the graph above for example. There are two lines so you know the system has two equations. Use whatever method you prefer to find the equations each line. I like to take two sets of points for each line and use y−y1=m(x−x1)y-y_1=m(x-x_1) where m=y2−y1x2−x1m=\dfrac{y_2-y_1}{x_2-x_1}.

So the equation for the red (vertical) line is: x=1x=1 And the equation for the blue (horizontal) line is: y=2y=2

Once we have our equations, we look at the highlighted region and determine if the equations are << or >>.

The highlighted purple region has xx points that are larger than 11 which is the equation of the line. So we can determine: x>1x>1 But the red line isn't dashed. This means the equation is greater than or equal to instead of just greater than. So the equation is actually: x≥1x\geq1

For the second equation we notice that the yy points for the highlighted region are larger than 22. So we can determine: y>2y>2 Since the blue line is dashed, we know that its only greater than and not greater than or equal to.

Given the above graph we can determine the system of linear inequalities to be: x≥1x\geq1 y>2y>2

Video · + 1 min read

(Video) Writing a System of Linear Inequalities from a Graph

by Rick Faulk

In this video by Rick Faulk, he goes over how to go from a graph to a system of linear inequalities.

Summary

In the graph below, we are working to figure out what the system of inequalities is that is represented by the graph.

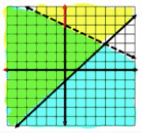
Three intersecting lines on a graph.

Image source: by Rick Faulk

We want to tackle this problem one inequality at a time.

We are first going to look at the dotted line. We can see that it's shaded below the line, so we can assume a less than sign: y<y< We can see that the yy-intercept is +5+5. So, we add that to our inequality: y<+5y< +5 We need a slope. We figure out that the slope is −12\frac{-1}{2}. y<−x2+5y<\frac{-x}{2} +5

We will do something really similar for the second line, the one going diagonally from the bottom-left to the top-right. We know that there is shading above the line, so we will use a greater than or equal to sign. y≥y \ge We can see that the yy-intercept is −1-1. Our next inequality becomes: y≥−1y \ge -1 We can calculate the slope to be 11. So, our second inequality is: y≥x−1y \ge x-1

Therefore, the system of linear inequalities that is represented by the graph are: y<−12+5y<\frac{-1}{2} +5 y≥x−1y \ge x-1

Try the next one on your own! Then follow along with the video to see how you did.

Type a concept, like “slope” or “photosynthesis”.

↑ ↓ to choose · Enter to openSearch explanations and problems