用绘制图像的方法求解非线性不等式

Video · + 1 min read

(Video) Graphing Nonlinear Inequalities

by mathman1024

Here's a video by mathman1024 showing you how to graph nonlinear inequalities. The inequality he looks at is y<(x−2)2−1y<(x-2)^2-1. Graphing nonlinear inequalities is pretty much the same as graphing linear inequalities.

  1. Figure out if you use a dashed line or solid line.
  2. Graph it as you would if it was an equality.
  3. Pick a point not on the line to test to see if you shade above or below the line.

Since the inequality uses the symbol ≤\leq, we know the graph’s boundary will be a dashed line. A dashed line means the points on the line are not included in the solution.

Next, draw the graph as if it were an equality. This gives you the basic shape of the graph before shading.

Because this is a quadratic, we need to look at each part of the equation to see how the graph is transformed.

  • The −2-2 inside the squared term shifts the graph to the right by 2 units.

  • The −1-1 outside the squared term shifts the graph down by 1 unit.

With these shifts, the graph so far will look like this:

graph

Finally, we pick a point to test to see where the graph should be shaded. Since (0,0)(0,0) is not on the parabola, I'll choose that. (0)<((0)−2)2−10<(−2)2−10<4−10<3\begin{align} \color{#8925AE}{(0)}&<(\color{#8925AE}{(0)}-2)^2-1\\ 0&<(-2)^2-1\\ 0&<4-1\\ 0&<3 \end{align} So is 00 less than 33? Yes it is! That means we shade the area outside the graph because that's where the point (0,0)(0,0) is located.

graph
y<(x−2)2−1y<(x-2)^2-1

Test Yourself: Graph the inequality y≥(x+1)2−4y\ge(x+1)^2-4.

Click continue to see the answer.

Click continue to see the answer!

Choose one answer

Video · + 2 min read

(Videos) Graphing Systems of Inequalities

by mathman1024

Here's a video by mathman1024 showing you how to graph a system of inequalities.

The system he looks at is the following: {y≤2∣x+2∣−6y>−12(x−1)2+4\begin{cases}y\leq2|x+2|-6\\y>-\frac12(x-1)^2+4\end{cases}

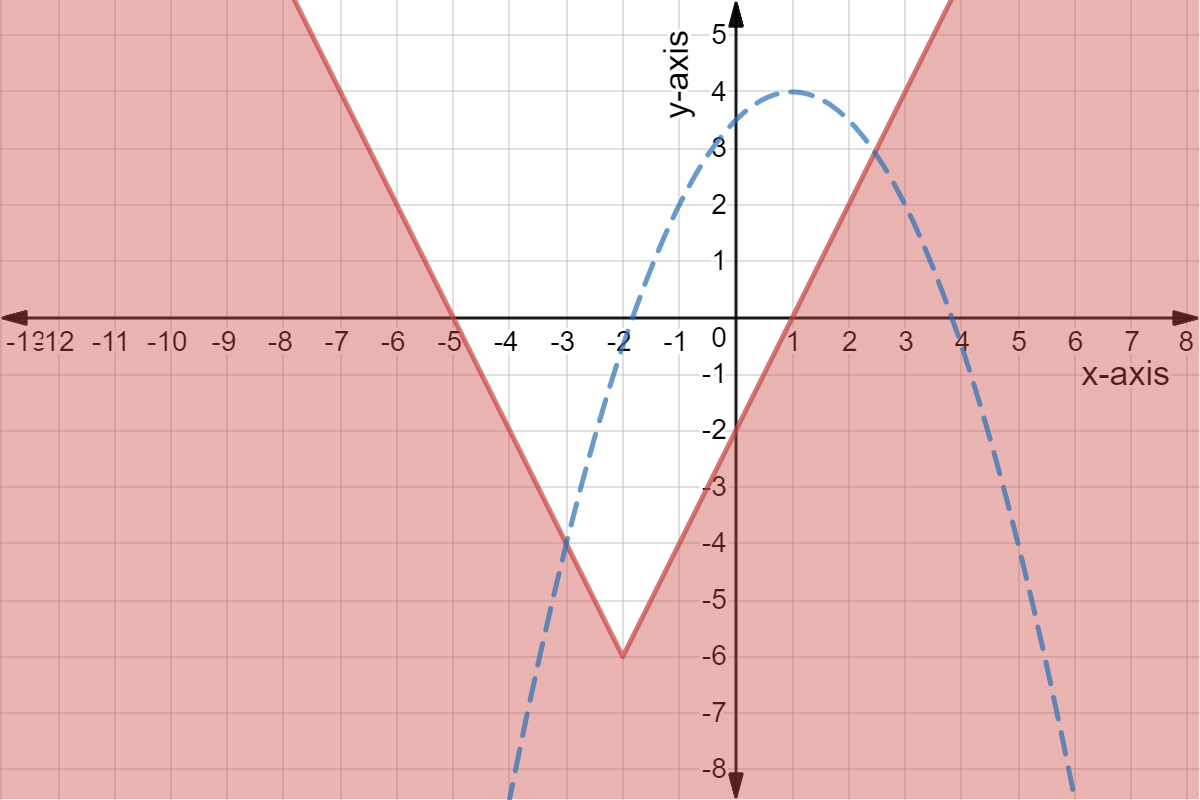
The first step is to graph the first function. The base graph is y=∣x∣y=|x|. The +2+2 on the inside moves the graph to the left 22 units. The −6-6 on the outside moves the graph down 66 units. The 22 being multiplied means the graph will be narrower.

A graph of y = 2|x+2| - 6.

Made using Desmos

Now we need to decide where the graph should be shaded.

To do this, pick a point that is not on the graph. A common and easy choice is (0,0)(0,0).

Next, plug that point into the inequality:

  • If the statement is true, you shade the side that includes the point.

  • If the statement is false, you shade the other side.

Let’s try this using the point (0,0)(0,0).

y≤2∣x+2∣−6(0)≤2∣(0)+2∣−60≤2∣2∣−60≤4−60≤−2\begin{align} y&\leq2|x+2|-6\\ \textcolor{#8925AE}{(0)}&\leq2|\textcolor{#8925AE}{(0)}+2|-6\\ 0&\leq2|2|-6\\ 0&\leq4-6\\ 0&\leq-2 \end{align}

Since zero is not less than or equal to negative two, the statement is false which means we don't shade on the side that contains the point (0,0)(0,0).

Updated graph of y <= 2|x+2| - 6.

Made using Desmos

Next we graph the second function. The base graph is y=x2y=x^2. The −1-1 inside means we shift the graph to the right by 11 unit. The +4+4 outside means we shift the graph up by 44 units. The 12\frac12 being multiplied means we stretch the graph. Finally, the negative sign means we flip it upside down.

Also since this function has >> instead of ≥\geq, we need to make a dashed line.

A dashed-line graph of y = -(1/2)(x-1)^2 + 4 overlying the previous graph.

Made using Desmos

Next we plug in a point to check where to shade. Again I choose (0,0)(0,0). y>−12(x−1)2+4(0)>−12((0)−1)2+40>−12(−1)2+40>−12+40>72\begin{align} y&>-\frac12(x-1)^2+4\\ \color{#8925AE}{(0)}&>-\frac12(\textcolor{#8925AE}{(0)}-1)^2+4\\ 0&>-\frac12(-1)^2+4\\ 0&>-\frac12+4\\ 0&>\frac72 \end{align} Since zero is not larger than 72\frac{7}{2}, the statement is false and we shade on the other side of the graph.

The area above y = -(1/2)(x-1)^2 + 4 is now shaded.

Made using Desmos

The solution to the system of inequalities is the part of the graph where the shaded regions overlap. This overlapping area shows all the points that satisfy every inequality in the system.

On the graph, this overlapping region is shown in purple. Only the points inside this region are solutions.

When we focus on just the overlap, we get:

The overlap generated by the system of nonlinear inequalities.

Made using Desmos

Video · + 2 min read

(Video) Harder Inequalities

by Eddie Woo

Here's a video by Eddie Woo where he shows you how to graph systems of nonlinear inequalities.

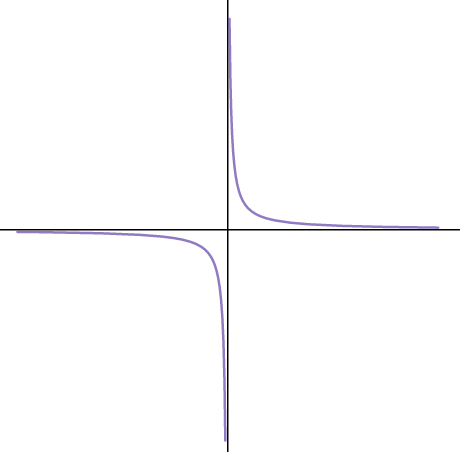
The first inequality he looks at is: y≥1xy\ge\frac1x. We begin by drawing the equality line. Since the inequality is ≥\ge, we use a solid line.

Graph of y\ge\frac1x

Made using Desmos

There are no points of intersection in this graph. This means the graph has a discontinuity, or a break.

Because of this break, the graph has two branches. One branch is on the left, and the other is on the right.

When you choose a test point, you must test one point from each branch. This helps you figure out which regions belong in the solution.

Testing both branches makes sure you find the correct solution region.

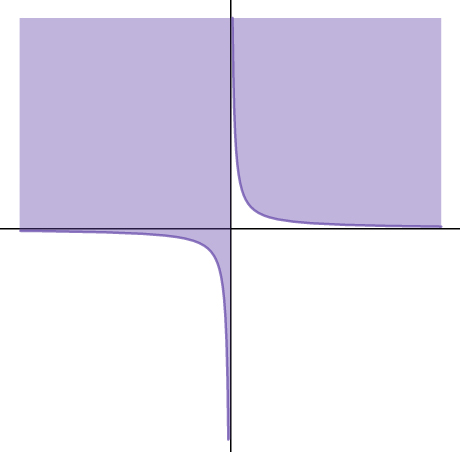
Let's choose the point (1,0)(1,0) on the right side to test. If we plug this in, we get that: 0≥10\ge1. This is not true so we shade the area that doesn't contain this point.

Now we have to test the other branch. Let's test the point (−1,0)(-1,0). If we plug this in, we get: 0≥−10\ge-1. This is true so we shade the left hand side above the line. We are shading the region represented.

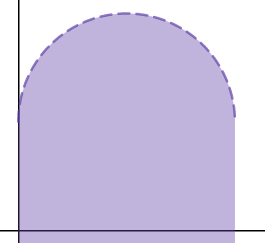
The next inequality he looks at is: y<1+1−(x−1)2y<1+\sqrt{1-(x-1)^2}. This is a semi circle. You have to figure out if it's the top half, bottom half, left half, or right half. This is the top half of the circle.

We begin by finding the boundary of the inequality. When we do this, the graph becomes a complete circle.

Because the boundary includes the entire circle, we then need to decide which half of the circle is part of the solution. This helps us focus on the correct region.

That’s why it is important to figure out which half of the semicircle we should use.

y=1+1−(x−1)2y−1=1−(x−1)2(y−1)2=1−(x−1)2(x−1)2+(y−1)2=1\begin{align} y&=1+\sqrt{1-(x-1)^2}\\ y-1&=\sqrt{1-(x-1)^2}\\ (y-1)^2&=1-(x-1)^2\\ (x-1)^2+(y-1)^2&=1 \end{align}

This is a circle with a center of (1,1)(1,1) with a radius of 11.

We now draw our equality, and use a dashed line because the inequality is <<.

Let's test the point (1,1)(1,1). Plugging it into the inequality we get: 1<21<2. This is a true statement so we shade below the line.

Illustrated · 1 min

Graphing Systems of Nonlinear Inequalities

A system of nonlinear inequalities is a set of two or more inequalities that include curved lines like parabolas or circles, not just straight lines. To graph the system, you’ll shade the area where all the inequalities overlap.

Graphing systems of nonlinear inequalities: the overlapping area in a system of nonlinear inequalities is the solution area

Made using Desmos

In the above graph, we can see two functions graphed:

y>2x2−6y<x3−1\begin{align} y > 2x^2 -6 \\ y < x^3 -1 \\ \end{align}

These are nonlinear because they include squares or other powers, not just xx and yy by themselves.

Since these are inequalities, we have to look at the shaded regions. The area where the shaded regions overlap is the solution to the system of nonlinear inequalities.

This overlapping region shows all the possible (x,y)(x,y) points that make every inequality true at the same time. Sometimes, the solution is inside a curved region like a circle or between two parabolas.

Graphing these systems helps you visualize the solutions to complex real-world problems that involve constraints or boundaries.

Illustrated · 1 min

Graphing Systems of Nonlinear Inequalities

In earlier lessons, you learned how to graph systems of nonlinear equations. Now we are going to take that idea one step further by looking at systems of nonlinear inequalities.

Nonlinear inequalities are similar to regular inequalities, but instead of straight lines, they involve curves. These curves show all the points that make the inequality true.

Let’s take a look at the following inequalities and see how they work.

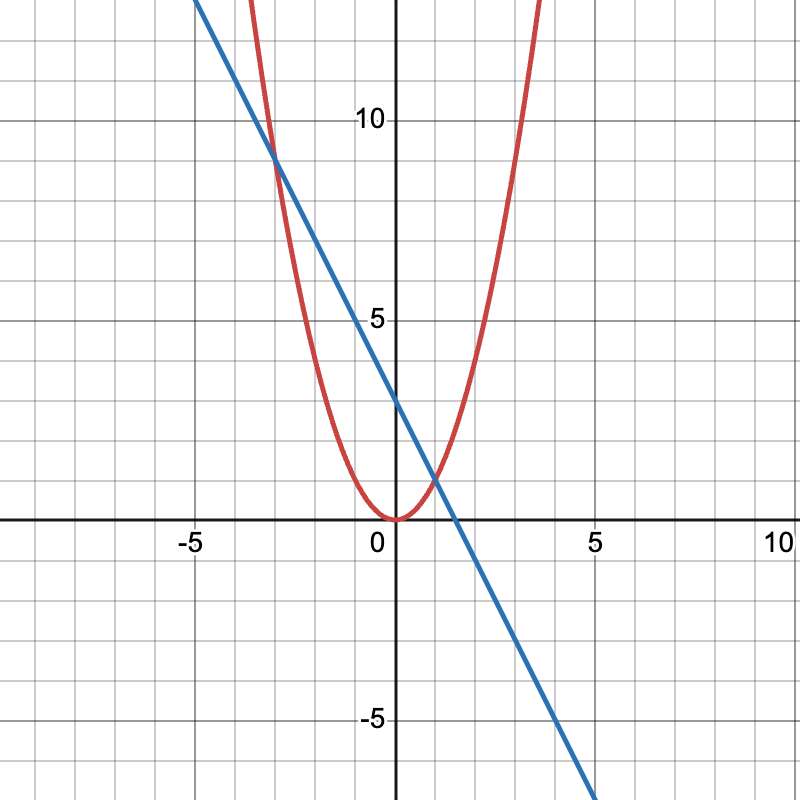
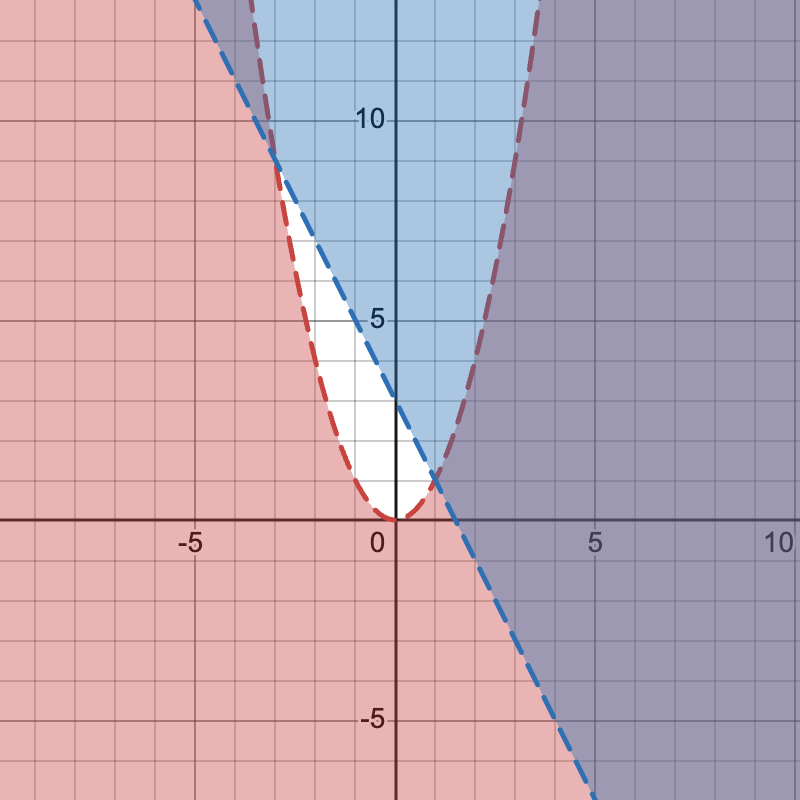
y<x2y<x^2 y>−2x+3y>-2x+3

The first inequality is a parabola, while the second inequality is a line. These inequalities show relationships where yy is either less than or greater than the expression on the right.

####First, Graph the Boundary

Start by graphing the equation as if it were an equality. For both inequalities, you can draw a dashed curve because the inequalities are not equal to.

Intersecting graphs of y=x^2 and y=-2x+3

Made using Desmos

####Next, Shade the Correct Area

For y<x2y<x^2, shade below the parabola because we want all the points where yy is less than x2x^2. For y>−2x+3y>-2x+3, shade above the line because we want all the points where yy is greater than −2x+3-2x+3.

Same graph as before, but with areas shaded

Made using Desmos

####Finding the Solution Region

The solution to a system of inequalities is the area where the shaded regions overlap. This overlapping area shows all the points that satisfy both inequalities at the same time.

On the graph above, the purple region is the solution region. Every point in this region makes both inequalities true.

After graphing each inequality, you may find that there is no overlapping region, meaning the system has no solution. We will cover this concept in a future lesson.

It's also possible that graphing doesn't work. Some systems require algebraic methods, such as the quadratic formula, to identify solution boundaries. We can even use elimination to make the inequalities simpler.

We'll use this technique for radical inequalities as well.

Type a concept, like “slope” or “photosynthesis”.

↑ ↓ to choose · Enter to openSearch explanations and problems