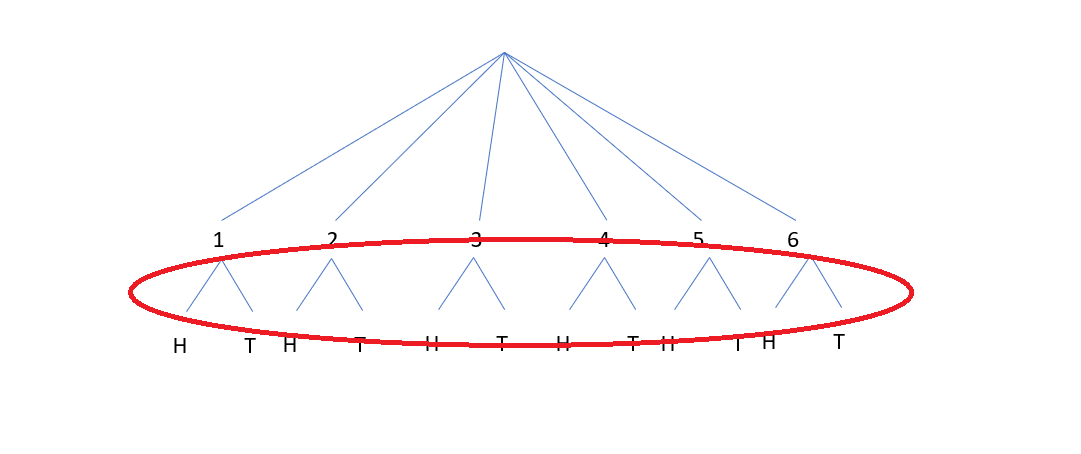
Illustrated · 1 min

Tree Diagram

Tree diagrams are not elaborate drawings of what you may find in a tree. Instead, a tree diagram is a visual tool that can be used to show the different types of outcomes in a situation. Let's do an example to show you how to draw a tree diagram:

Let's say that we want to roll a standard die and flip a standard coin. How many outcomes are there, and what are these said outcomes?

We start by focusing on the different outcomes of the die. Since it is a standard die, it has 66 sides, so the tree diagram will look like:
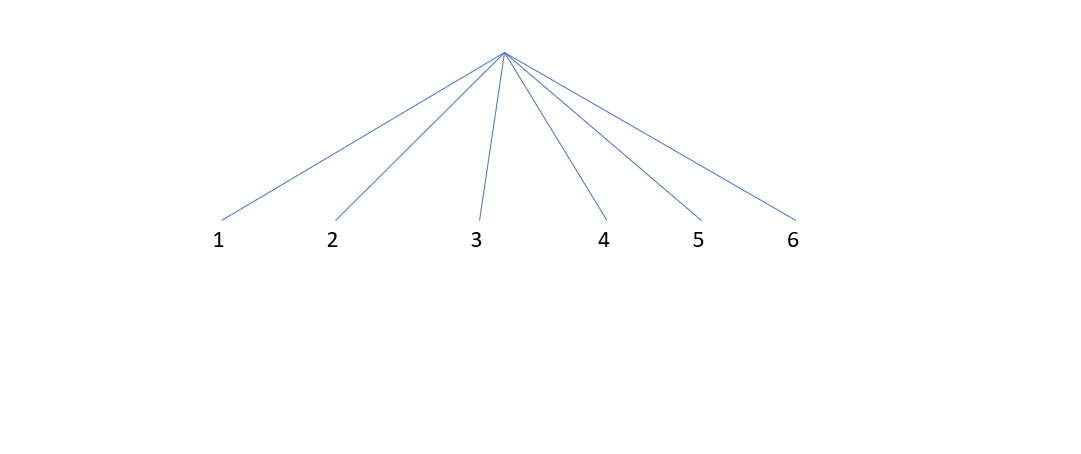
Top of the tree diagram where there are 6 branches labelled 1,2,3,4,5,6

Diagram by Sarah Walker

Now, once the die is rolled, a standard coin is flipped. A standard coin has 22 outcomes: a heads (H) and a tails (T). Since it is equally likely get a heads or tails, the diagram will look like:
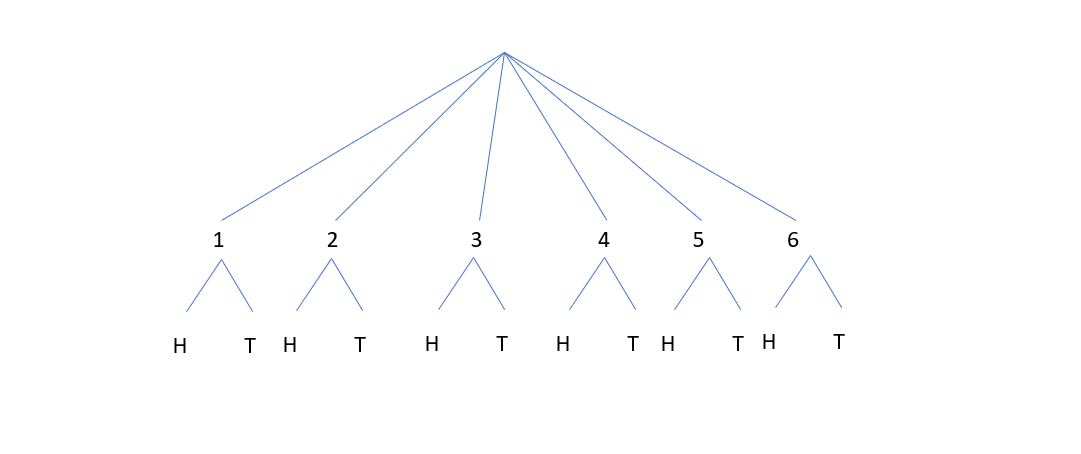
Tree diagram including branches 1,2,3,4,5,6, as well as 2 more branches, H and T, on each numerical branch.

Diagram by Sarah Walker

Notice that each numerical branch now has an H and a T attached to it! So, in order to get a final number of outcomes, we can either 1)1) count the number of H's and T's, or count the number of smallest branches
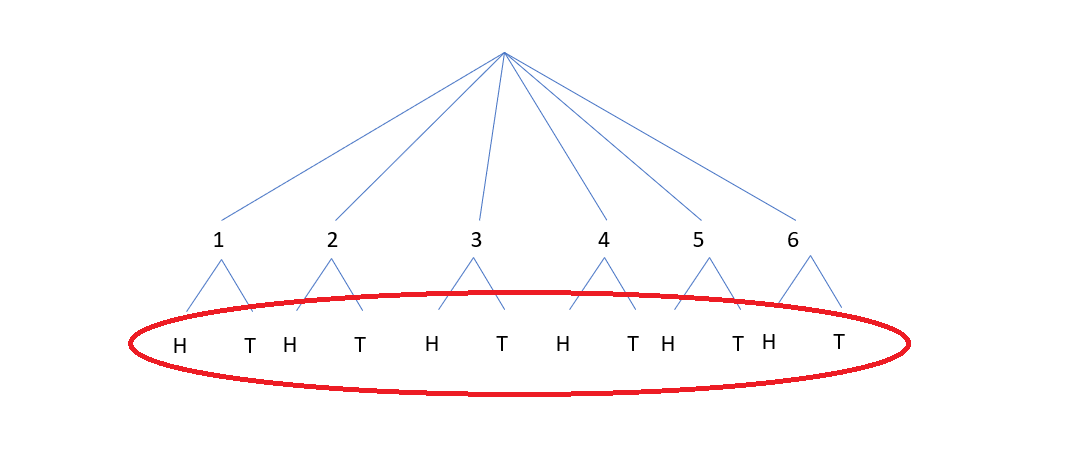
The same diagram as above, but with a red circle around all the H and T values, which add up to a total number of 12 outcomes

Diagram by Sarah Walker

The same diagram as above, but with a red circle around all the branches, which add up to a total number of 12 outcomes

Diagram by Sarah Walker

Once you pick your poison, and count the number of whatever you like, you will see that we have a total of 1212 outcomes!

Tree diagrams take quite a while to draw, and are not ideal for events that have many outcomes. However, it is still fun to draw and visually see how many outcomes numerous events will have! They can also make great images for presentation slideshows to impress your friends and flex on them.

Tree diagrams are especially useful for illustrating independent events, where the outcome of one event does not affect the outcome of another.

Worth the struggle

Twenty minutes on one hard problem can teach more than ten easy exercises. These problems are worth staying with. These are real problems from the AMC 8, AMC 10 and AMC 12, the national math competitions for middle and high school students, each with a worked solution on LIVE by Po-Shen Loh.

Video

(Video) Tree Diagram Examples

by MooMooMath and Science

In this video by MooMooMath and Science, you will learn about using a tree diagram for probability.

Follow along with the video's example of choosing an outfit for the day. You can see how the tree diagram is a way to help organize multiple outcomes and their associated probabilities. First, the man has to choose what shirt to wear, then what pants to wear, then what shoes to wear.

You can then use the tree diagram to calculate the probabilities. To find the total number of possibilities, you can multiply the choices at each step. If there there are 2 total shirts, 2 pants, and 2 shoes, you would do 2∗2∗22*2*2 which would mean there are 8 total possibilities. Then, if you want to know the probability associated with a certain combination of options, like wearing a blue shirt, black pants, and purple shoes, it would be 1/81/8.

Illustrated · 1 min

In the previous lesson, we learned about the Fundamental Counting Principle. Now, we will learn about the tree diagram.

Tree Diagram for Number of Outcomes

A tree diagram is a visual way to organize all the possible outcomes of a situation. Each branch represents one choice that can be made. As more choices are added, the tree grows more branches.

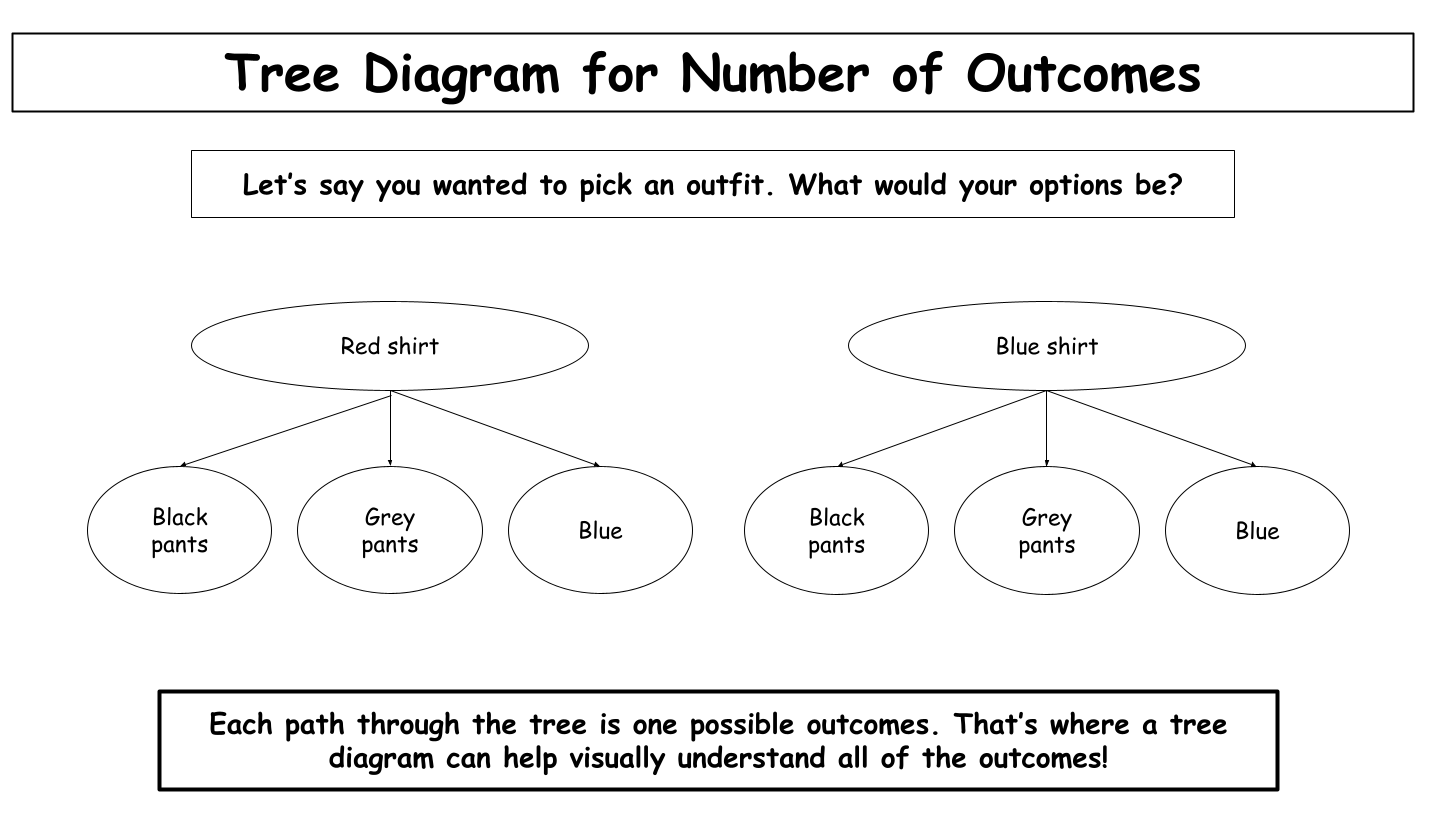
Each path through the tree is one possible outcomes. That’s where a tree diagram can help visually understand all of the outcomes!

Image source: by Anusha Rahman

For example, imagine that you are picking your outfit for the day. You have two shirts and three pairs of pants to choose from. The first set of branches shows the two shirt choice: red shirt or blue shirt. Each shirt branch then splits into three more branches for the black, grey, or blue pants.

To find one possible outfit, follow a path from the beginning of the tree to the end. Each complete path represents one possible outcome. In this example, the tree has six complete paths, so there are six possible outfits.

Tree diagrams are especially useful when a situation involves two or more steps. By following and counting the branches, you can find the total number of possible outcomes without accidentally missing any possibilities.

Type a concept, like “slope” or “photosynthesis”.

↑ ↓ to choose · Enter to openSearch explanations and problems