Video · + 5 min read

(Videos) Summary of Curve Sketching
by PatrickJMT

Here's a set of videos by patrickJMT where he shows you how to do a full blown analysis on a function in order to graph it. We're talking all the tests, tricks, and topics that have been covered up to and including calculus when it comes to graphing. All in one convenient place.
In these videos he goes over:
- Domain
- Intercepts
- Symmetry
- Asymptotes
- Intervals of Increase/Decrease
- Local Max/Mins
- Concavity
- Sketching the Graph

The luckily function we're looking at tonight is Let's begin.
Domain
The domain of a function is all the possible values of that function. When finding the domain of a function we basically just want to find any values where our function becomes undefined. Some examples would be a zero in the denominator or a square root sign with a negative value.
Luckily, for us our function can have both of these happen so we need to figure out where it happens and exclude those points from the domain.
First, let's find where our denominator equals zero.
Since we got an imaginary number, we can conclude that there's no value of that makes our function's denominator zero. So far so good. Let's now check to make sure we don't get any negative values inside our square root.
Again, since we got an imaginary number, we can conclude that there's no value of that makes a negative value inside the square root.
So our domain is all real numbers, , or .
Intercepts
The intercepts are the points where the function crosses either the -axis or the -axis. To find these, we set either the values equal to zero or the values equal to zero.
Let's start with the -intercept. To find this we set .
So our function crosses the axis at . In other words, we know that the point is on the graph.
If you think about it, the point is also an intercept but we'll still work through it to show this.
Let's find the intercept now by letting () equal zero.
This tells us we have an intercept at .
Symmetry
A function is considered even if . This means if we plug in a negative value we get the answer we would if we plugged in its positive counterpart. If a function is even it is symmetric about the -axis.
A function is considered odd if . This means the function is symmetric about the origin; the line .
So we test our function by plugging in .
Notice how we got out the negative version of the function we started with. Therefore our function is odd and it is symmetric about the origin.

Asymptotes
A vertical asymptote is a point where the function is some nonzero value over zero. But we already looked at this when we looked at domain. We set the denominator equal to zero and found there were no points where this happens. So, there's no vertical asymptotes in our graph.
To find a horizontal asymptote we need to look at and .
Let's look at when .
We need to apply a trick to be able to take this limit since it gives us infinity over infinity. For a closer look at how to do this, watch his previous video.
Look in the denominator and choose the largest power. In this case, it's . But it's also under a square root so we need to apply this to the largest power we selected, . This result is what we divide the numerator and denominator by.
Now if we take the limit we get a better answer. \begin{align}\lim_{x\rightarrow\infty}\frac{1}{\sqrt{1+\frac1{x^2}}}&=\frac{1}{\sqrt{1+\frac{1}{\infty}}}\ &=\frac{1}{\sqrt{1+0}}\ &=1 \end{align}
So we now know that is a horizontal asymptote.
Next, let's check the limit at negative infinity.
We still have to divide by the highest power in our denominator, like above.
But there's one caveat to be weary of. It's incorrect to just square this term and put it under a radical sign like so:
If we plug a negative number into we get out a negative answer. But if we plug a negative number into we get out a positive answer. So these two are not equal. To fix this we need to place a negative sign out front.
So now let's take the limit. \begin{align}\lim_{x\rightarrow-\infty}\frac{1}{-\sqrt{1+\frac1{x^2}}}&=\frac{1}{-\sqrt{1+\frac{1}{-\infty}}}\ &=\frac{1}{-\sqrt{1+0}}\ &=-1 \end{align}
So we have a second horizontal asymptote at .

Increasing and Decreasing
To figure out where the graph is increasing or decreasing we need to look at the derivative.
Once you have the derivative find the values of that make it zero or undefined. These will be your critical points.
If we try to set this derivative equal to zero and solve you'll find we get a false statement which means there's no solution.
To make the derivative undefined we would want the denominator to equal zero. But again you'll find that there are no solutions.
So this function doesn't have any critical points. But we can still test if the function is increasing or decreasing. Just take any number within the interval and plug it into the derivative. \begin{align} f'(0)&=\frac{1}{(\color{red}{(0)}^2+1)^{\frac32}}\ &=1 \end{align} Since the derivative comes out positive, we know the function is increasing on this interval, or always increasing.
Local Extrema
Because our function is always increasing, we know there will be no local maximums and no local minimums.
Concavity
To look at concavity we need the second derivative of our function. \begin{align} f'(x)&=\frac{1}{(x^2+1)^{\frac32}}\ &=(x^2+1)^{-\frac32}\ f''(x)&=-\frac32(x^2+1)^{-\frac52}\cdot\color{red}{[x^2+1]'}\ &=\frac{-3}{2(x^2+1)^{\frac52}}\cdot2x\ &=\frac{-3x}{(x^2+1)^{\frac52}} \end{align}
Again, we need to find where our derivative equals zero or is undefined. Let's set it equal to zero first.
We should also set the denominator equal to zero to see where it's undefined but this will yield no solution like above.
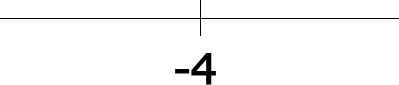
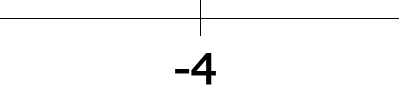
So our sign chart would look like
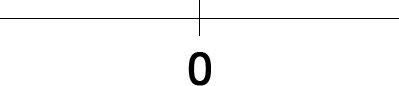
Choose a point within each of these intervals and plug it into the second derivative to find its sign.
If we plug in a negative number we get a positive over a positive which is a positive number. This means the graph is concave up on this interval.
If we plug in a positive number we get a negative over a positive which is a negative number. This means the graph is concave down on this interval.
Because the graph switches concavity at we call it an inflection point.
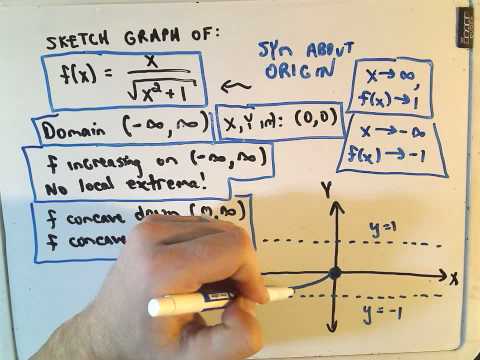
Recap
- Symmetric about the origin.
- Domain
- and intercept at
- Horizontal asymptotes at
- Increasing on
- No local extrema
- Concave down on
- Concave up on
Sketch
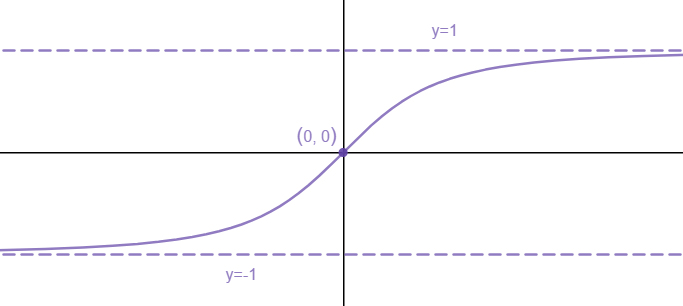
Finally, we can sketch our graph. Let's start with the skeleton. Place all known values down and any asymptotes.
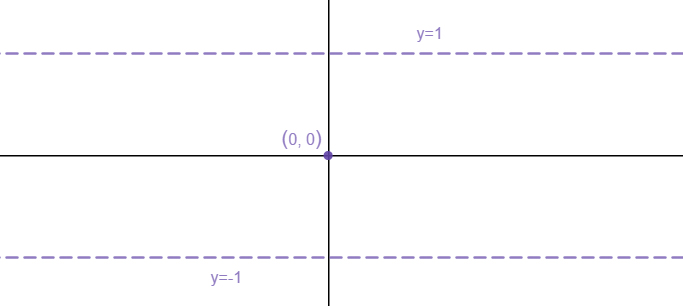
Now given the rest of the information we can sketch.