普通的非线性函数

Illustrated · 2 min

Nonlinear Functions

Before we get into some common nonlinear functions, make sure you understand what nonlinear functions are and what makes them different from linear functions.

When graphed, nonlinear functions are not straight lines (i.e., they are non linear).

Nonlinear functions are those that DO NOT follow the form:

y=mx+by=mx+b

So, functions that have a term where xx is part of a complicated operation (like x2x^2, x3x^3, or 1x\frac{1}{x}) are examples of nonlinear functions.

On this page, we'll look at three of the most common nonlinear functions: x2x^2, x3x^3, and 1x\frac{1}{x}.

Functions with x2x^2

Functions with the term x2x^2 have a distinct U-shape when they are graphed. This shape is called a parabola. Think of it like a smile or a rainbow!

Graph on left is quadratic, y=x^2. Graph on the right is quadratic, but facing downward, y=-x^2.

Image source: by Hannah Bonville

Notice that when the function includes the term x2x^2, the parabola faces up. When the function includes the term −x2-x^2, the parabola faces downward.

The term in the function that doesn't include xx (i.e., the naked/plain number) tells us where the parabola crosses the y-axis.

Graph of y=x^2 +3

Made using Demos

The function graphed above is y=x2+3y=x^2+3. Because the naked/plain number in the function is 33, we know that the parabola crosses the y-axis at y=3y=3.

The coefficient of the x2x^2 term in the function determines how narrow or wide the parabola is. The larger the coefficient is, the narrower the parabola will be.

Functions with x3x^3

Functions that include the term x3x^3 have a double J-shape when they are graphed. Imagine drawing a squiggly line in the middle of the graph.

Graph of y=x^3

Made using Demos

As with the x2x^2 functions, the sign in front of the x3x^3 determines which way the shape of the graph goes. Here is a graph of y=−x3y=-x^3.

It grows faster than a straight line (linear) or a U-shape (quadratic).

Graph of y=-x^3

Made using Demos

Functions with 1x\frac{1}{x}

Functions that include 1x\frac{1}{x} (or any form of that fraction where xx is in the denominator), have an L shape, like a swoop.

There are two symmetrical swoops per graph, and two asymptotes. An asymptote is a place on the graph where the line absolutely cannot pass.

Because xx is the denominator of a fraction, there is a vertical asymptote at x=0x=0. That means that there's no possible value for x=0x=0 (because you can't divide by 00)!

(There's also a horizontal asymptote at y=0y = 0, but you don't have to worry about that yet!)

Graph of y=1/x

Graph made using desmos

Notice how both swoops approach, but never touch, x=0x=0. This is the location of the asymptote.

As with the other nonlinear functions, when we make the leading term negative, the graph changes. It flips over diagonally, but the asymptotes remain the same.

Graph of y=-1/x

Made using Desmos

There are other factors that can change where all of these graphs appear on the plane, but the shapes will always stay roughly the same!

Illustrated · 2 min

To understand more complicated functions, it helps to start with parent functions. A parent function is the simplest form of a function.

Parent functions have basic shapes and behaviors. We can change these shapes by stretching, shrinking, or shifting the graph.

By learning parent functions first, it becomes easier to understand how more complex functions are built.

In this lesson, we’ll explore the most common parent functions and learn how they work as the foundation for many other types of equations. Once you understand these basic shapes, you’ll have a better grasp on how more complex functions behave!

Parent and Common Functions

We are going to look at parent functions, which are basically the main function in which the rest of the family of functions is derived from. This lesson will exclusively cover algebraic functions, but you will soon learn about:

If you are interested more broadly in polynomial transformations, you can learn those, as well. It's a similar concept, while also includes combining transformations.

Quadratic Functions

Quadratic parent function with points

Image source: by Ben Ferrara

The quadratic parent function is written as f(x)=x2f(x) = x^2, and its graph is a smooth, U-shaped curve called a parabola. The vertex is the point (0,0)(0,0), which is the origin, and it opens upward. As the value of xx gets larger or smaller, the value of f(x)f(x) increases rapidly, showing the function's symmetric and curved nature.

Cubic Functions

Cubic parent function with points

Image source: by Ben Ferrara

The cubic parent function is written as f(x)=x3f(x)=x^3, and its graph has an S-shape, with one curve rising and the other falling. The origin is the point of symmetry, and the function passes through the origin. Values become more positive or negative as xx moves away from zero. Unlike the quadratic function, the cubic function can have both positive and negative values for $f(x) and continues to rise or fall without bound.

Exponential Functions

Exponential parent function with points

Image source: by Ben Ferrara

The exponential parent function is written as f(x)=bxf(x)=b^x, where bb is a positive constant greater than one. Its graph shows rapid growth or decay, depending on whether bb is greater than 11 (growth) or between 00 and 11 (decay). The graph always passes through the point (0,1)(0,1). As xx increases, the function grows quickly. While xx decreases, the function approaches zero but never actually reaches it.

Absolute Value Functions

Absolute value parent function with points

Image source: by Ben Ferrara

The absolute value parent function is written as f(x)=∣x∣f(x)=|x|, and its graph forms a V-shape with a sharp point at the origin (0,0)(0,0). The function outputs only non-negative values, meaning it reflects any negative inputs to positive values, creating two straight lines that open upward. The graph is symmetric around the yy-axis, with both sides having the same steepness.

Trig Functions

Trig parent function with points

Image source: by Ben Ferrara

The parent trigonometric function, like f(x)=sin(x)f(x)=sin(x) and f(x)=cos(x)f(x)=cos(x), have wave-like graphs that repeat in regular intervals. The sine function starts at the origin and oscillates between −1-1 and 11, while the cosine function starts at (0,1)(0,1) and also oscillates between −1-1 and 11. Both functions have a period of 2π2\pi, meaning they repeat every 2π2\pi units along the xx-axis, making them perfect for modeling cyclical behaviors like sound waves, tides, or seasonal patterns.

Looking Beyond

If you want to consider the implications beyond Algebra 22, then you can also look into transcendental functions.

Video · + 1 min read

(Video) Graphs of Non-Linear Functions

by Larry Schmidt

In this video, LarrySchmidt describes four types of common nonlinear functions and how to recognize them. The functions he describes are:

Quadratic functions: f(x)=x2f(x) = x^2\\ Cubic functions: f(x)=x3f(x) = x^3\\ Square root functions: f(x)=xf(x) = \sqrt{x}\\ Absolute value function: f(x)=∣x∣f(x) = |x|\\

The functions he describes are in their basic forms. They match the equations in the list exactly.

When equations become more complicated, the graphs can shift on the coordinate plane. They can also be stretched or compressed up, down, left, or right.

Even when this happens, the overall shape stays the same. A quadratic function will always look like a “U” or an “∩”. An absolute value function will always have a sharp V-shape, just flipped or moved.

These patterns help you recognize functions, even when the equations look different. Watch the video, then try this next question!

graph

Image source: by Ben Ferrara

What type of function does the graph above fit?

Choose one answer

Interactive · 1 question

Visualizing a few types of common functions \\

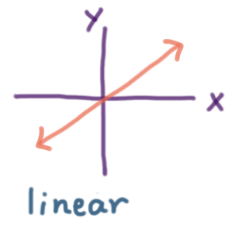
We've learned about the linear function. Here is a graph of one:

Graph of linear function

Image source: by Christine

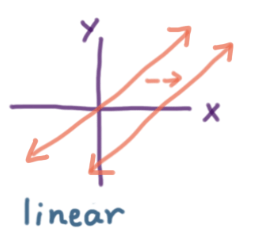
You can spin it, move it, squeeze and it will still be a linear function. Linear function is a type of common function.

A linear function that has been moved to the right with a horizontal transformation

Image source: by Christine

There are a lot of different types of function and they are used to describe different relationships. Here is a chart of a few common functions, you will be seeing them more in the future. Observe how they are different.

Graphs of common functions. The quadratic graph is a U shape that goes to positive infinity in the y direction, the cubic graph has two different turns, the square root graph starts at (0,0) and goes positively in both the x and y directions, and cubed root continues in both the first and third quadrants.

Image source: by Christine

If you are interested, the chart below also shows the graphs and expressions of these functions.

Graphs with their functions below. Quadratic y=x^2, cubic y=x^3, square root y=x^1/2, and cube root y=x^1/3

Image source: by Christine

To test your understanding, take a look at the function below:

A downward facing U shaped graph

Image source: by Christine

What kind of function is it?

Choose one answer

Illustrated · 1 min

Graphs as Bulls

There are some really fun ways to remember the shapes for parent functions. This image of bulls is a great way to memorize some of the common parent functions!

y = c is a straight line

y = x^3 starts low and curves up

y = x^2 is a U shape

y = cos x is like a snake

Image drawn by Sylvia Freeman

Imagine these bulls the next time you're thinking about parent functions! Parent functions are like the starting point for all other functions. They're the simplest examples.

Linear functions are the easiest type of function to understand. They always make straight lines. Their equation is like a recipe: y=mx+by=mx+b. The mm tells you how steep the line is, like a hill. The bb shows where the line starts.

A quadratic function makes a U-shaped graph called a parabola.

The cubic function has an S-shaped curve, looking like a squiggly line. It grows faster than a straight line or quadratic function.

Exponential functions grow really, really fast - faster than straight lines or U-shapes. Their graph gets really close to the xx-axis but never actually touches it, like a plane that's about to land but never does.

The absolute value function makes a V-shape. It's like drawing two straight lines that meet at a point. It flips any negative number into a positive one. For example, −3-3 becomes 33!

Type a concept, like “slope” or “photosynthesis”.

↑ ↓ to choose · Enter to openSearch explanations and problems