Menggambar grafik suatu fungsi logaritma

Before this, knowGrafik dan sifat-sifat

Video

(Video) Graphing Logarithmic Functions

by ThinkwellVids

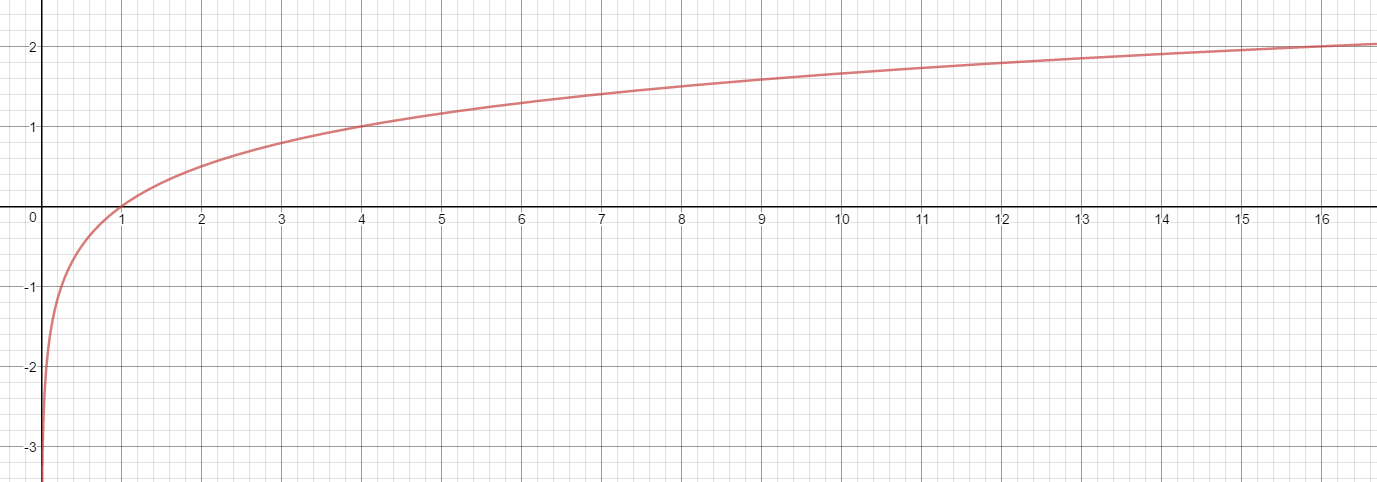
Here's a video by ThinkwellVids going over the graph of logarithms. In the video, he explains that to graph these functions the best approach is to pick some numbers and plug them in. He shows that the larger the base, the slower the graph grows along the yy-axis.

A logarithmic graph that has an asymptote at x=0 and goes through the following points: (1,0), (4, 1), (16, 2).

Created using Desmos

Test Yourself: What base is this log function?

Choose one answer

Video

(Video) Matching Logarithmic Functions with Their Graphs

by ThinkwellVids

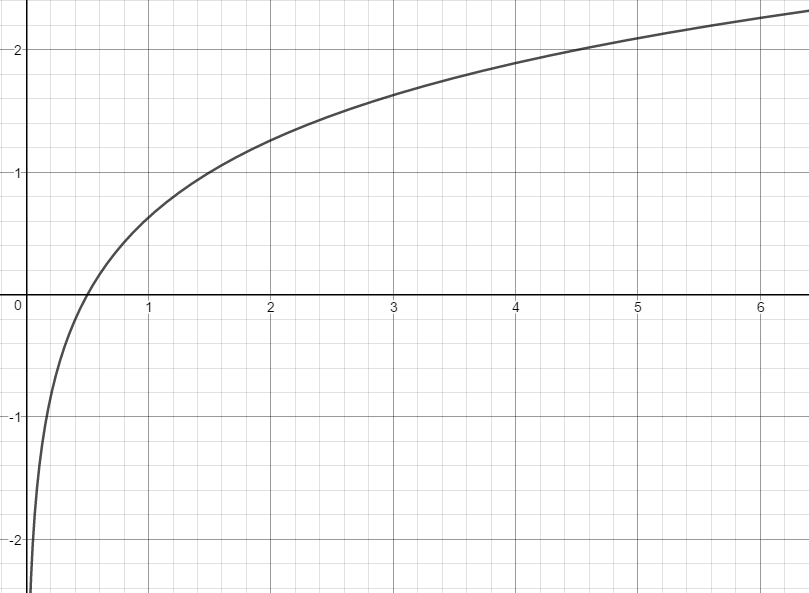
Here's another ThinkwellVids video going over some exercises to draw a graph given a logarithmic function. There are different ways that the standard logarithmic graph can be changed. y=log⁡x±ay=\log{x\pm a} shifts the graph left or right depending on if it's plus or minus respectively. y=log⁡x±ay=\log{x}\pm a shifts the graph up or down depending on if it's plus or minus respectively. y=log⁡axy=\log{ax} stretches or compresses depending on if a>1a>1 or 0<a<10<a<1 respectively.

A logarithmic graph with an asymptote at x=0 and goes through (1/2, 0).

Graph created using Desmos

Test Yourself: What is the function graphed above?

Choose one answer

Illustrated · 1 min

Graphing a Log Function

Graphing logarithmic functions (with real numbers) is kind of different from graphing other types of functions. The best way to graph logarithmic functions is to graph exponential functions, then find the inverse of that graph.

So, our first step will be to graph the exponential function, axa^x. Once we've done that, we want to reflect the exponential function over the line y=xy=x, which will give the inverse function. This new inverse function is our logarithmic function.

Steps:

  1. Graph the exponential function.

  2. Draw y=xy=x.

  3. Reflect the function over y=xy=x.

Example:

Graph the function log⁡3(x)\log_3 (x).

Step 1: Graph the exponential function.

The corresponding exponential function for log⁡3(x)\log_3 (x) is 3x3^x. The graph of 3x3^x looks like:

Graph of 3^x

Made using Desmos

Step 2: Draw y=xy=x.

Graph of 3^x and y=x

Made using Desmos

Step 3: Reflect the function over y=xy=x.

Graphs of 3^x, y=x, and log(base3)x

Made using Desmos

We have graphed our logarithmic function! Here is a graph of log⁡3(x)\log_3 (x) on its own.

Graph of log(base3)x

Made using Desmos

Looking Forward

Log functions will have certain features, like horizontal and vertical asymptotes, which you will learn about in future lessons. You'll also learn how to add and subtract log functions with the same base.

Illustrated · 1 min

Graphing a Log Function

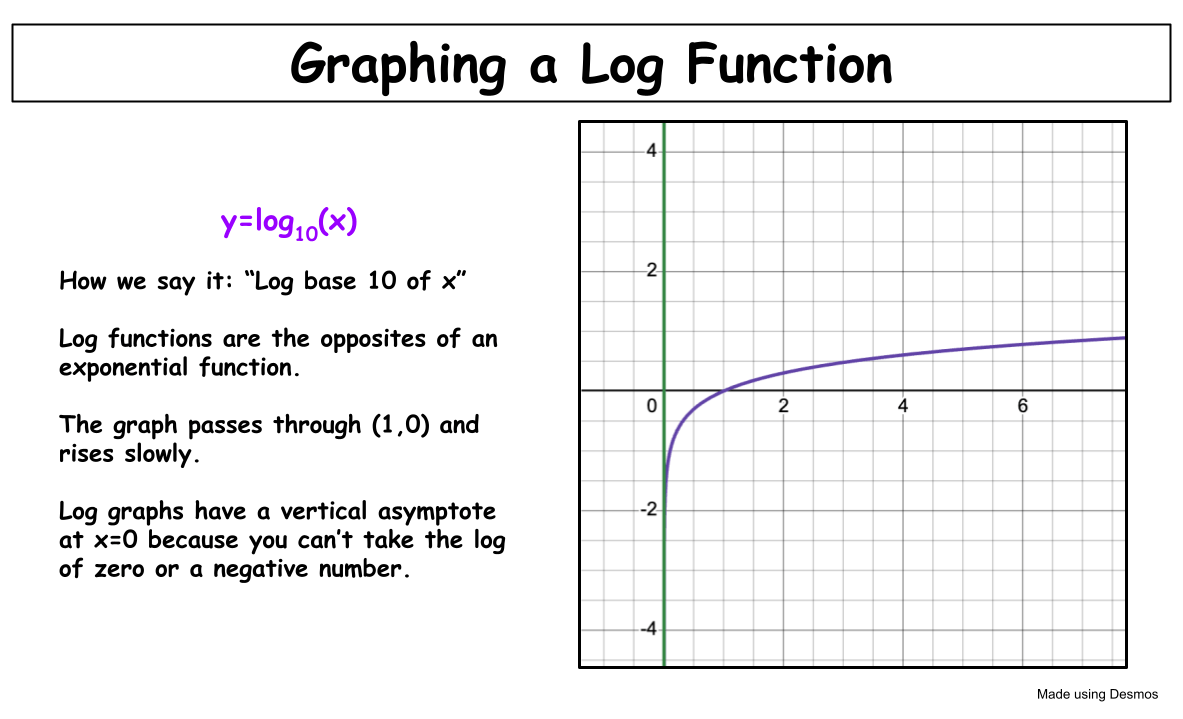
A logarithmic function is the opposite of an exponential function.

y=log10(x)

How we say it: “Log base 10 of x”

Log functions are the opposites of an exponential function.

The graph passes through (1,0) and rises slowly.

Log graphs have a vertical asymptote at x=0 because you can’t take the log of zero or a negative number.

Made using Desmos

The most basic log function is: y=log⁡b(x)y=\log_b (x)

We verbally say, "log base bb of xx". That is exactly what this function is: a logarithm with base bb of xx. It tells us to what power we raise bb in order to get xx.

To graph a log function, it helps to make a table of values. Choose xx values that are powers of the base, then solve for yy. For example, if b=10b=10,

  • log⁡10(1)=0\log_{10}(1)=0
  • log⁡10(10)=1\log_{10}(10)=1
  • log⁡10(100)=2\log_{10}(100)=2

Plot those points on the graph. You'll notice that the graph passes through the point (0,1)(0,1) and rises slowly as xx increases.

Log graphs will always have a vertical asymptote at x=0x=0 because you can't take the log of 00 or a negative number. The graph gets very close to the yy-axis but never touches it.

If you're curious, you can also learn how to find the range and domain algebraically.

Type a concept, like “slope” or “photosynthesis”.

↑ ↓ to choose · Enter to openSearch explanations and problems