Interactive · 6 questions
+6 contributors





Percentiles
In an earlier lesson, we learned about the median and quartiles in box and whisker plots. In the next lesson, we'll learn about stem and leaf plots. This lesson will cover percentile rank.
A percentile tells us what percent of values in a data set are at or below a given number.
Whenever you take the SAT the ACT, you'll most likely get your score as a percentile.
Let's say my score on one of those tests is in the th percentile.
This means that:
Julie got a on the SAT. In the US, of test-takers scored less than or equal to a .
In which percentile did Julie score?
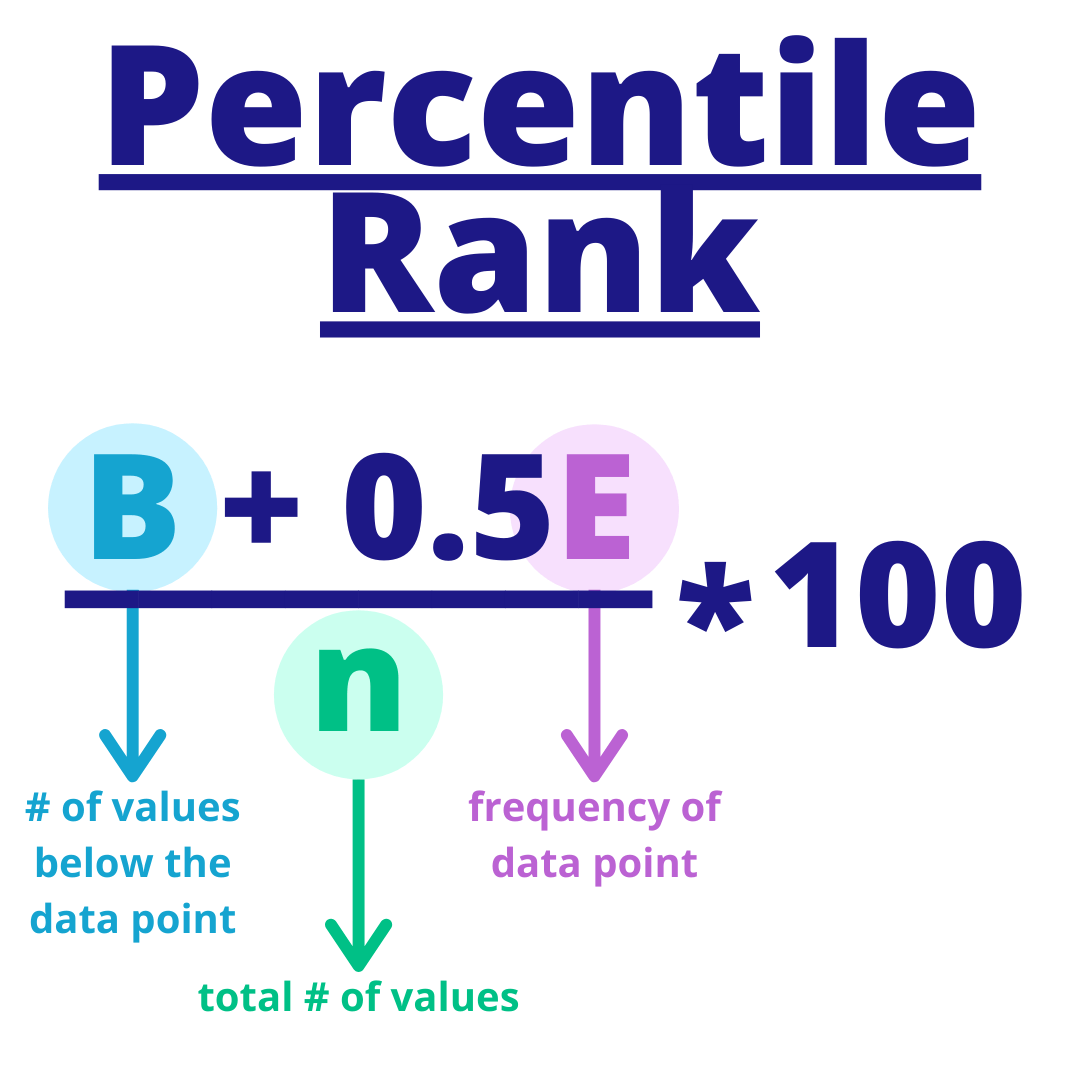
You use this formula to calculate the percentile rank of a given data value,
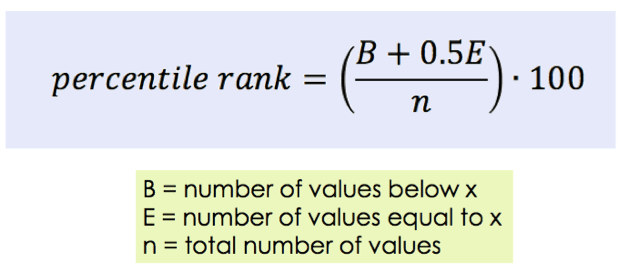
Image source: by Hannah Bonville
Let's try an example.
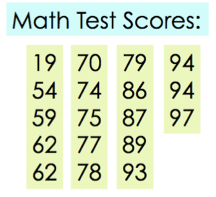
Image source: by Hannah Bonville
How many total math scores are there in our dataset?
Juan scored a % on the math test.
How many people scored below Juan? (This is the B in our formula)
How many people scored as well as Juan? (This is the E in our formula)
Using the formula above (copied again below), what is the percentile rank of Juan's score?
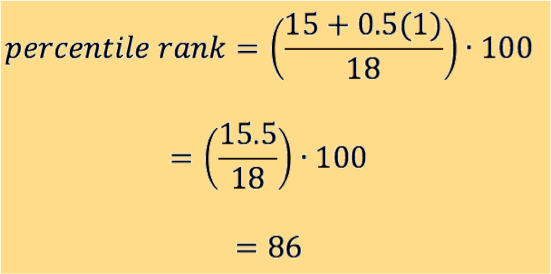
Image source: by Hannah Bonville