
Interactive · 9 questions
+6 contributors





Five Number Summary
The five number summary is an example of a descriptive statistic. They are values that provide us with the most important features of our data.

Image source: Hannah Bonville
Before you attempt to create a five number summary, PUT YOUR DATA VALUES IN ORDER.

Image source: by Hannah Bonville
Here is the ordered data set:
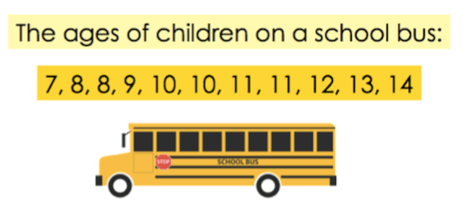
Image source: by Hannah Bonville
What is the minimum value in our dataset?
What is the maximum value in our dataset?
You've just identified numbers in your five number summary - minimum and maximum.
Now, let's do the median. If you need a refresher on how to find the median (middle value), click here.
What is the median age of kids in our bus dataset?
Nice! Now, the only numbers in our five number summary we need to identify are the first quartile and the third quartile.
Exclude the median value! In other words, the First Quartile is the median of the data less than the overall median, and the Third Quartile is the median of the data greater than the overall median.
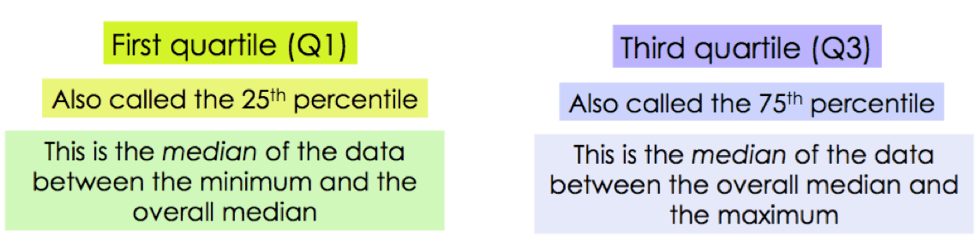
Image source: by Hannah Bonville
Let's look at our data of the kids' ages again:
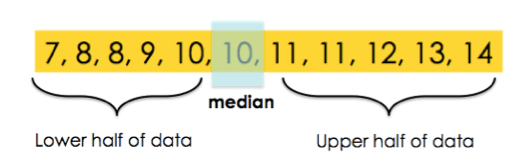
Image source: by Hannah Bonville
The first quartile (Q1) is the median of the lower half of our data. This is the data less than the median, not including the median. What is the first quartile? The first quartile is .
The third quartile (Q3) is the median of the upper half of our data. This is the data greater than the median, not including the median. What is the third quartile? The third quartile is .
So, our five number summary:
- Minimum:
- Q1:
- Median:
- Q3:
- Maximum:
We can look at the minimum and maximum values to find the dispersion of the dataset.
Let's try finding the five number summary for a new dataset:

Image source: by Hannah Bonville
What is the minimum value in our data set?
What is the median (Q2) of our data set?
What is the first quartile (Q1) of our data set?
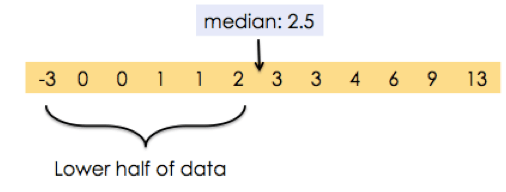
Image source: by Hannah Bonville
What is the third quartile (Q3) of our data set?
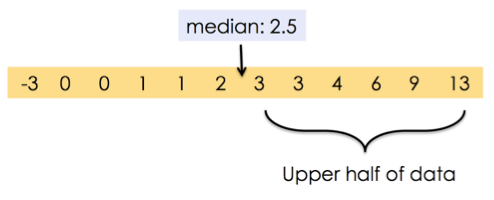
Image source: by Hannah Bonville
What is the maximum value in our dataset?
What is the five number summary for our data?
Five number summary on a box-and-whisker plot
Plots can be drawn like so:
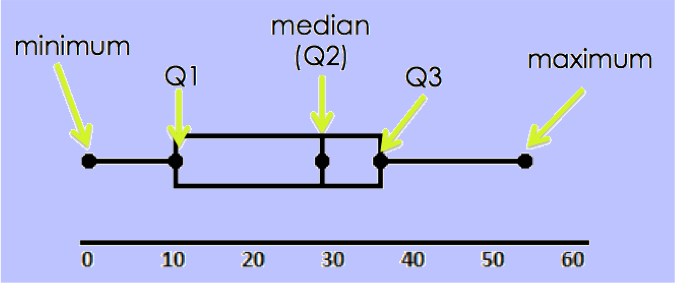
Image source: by Hannah Bonville
Further data analysis can also be done with these plots. We can calculate interquartile range, which is the middle of the dataset, the difference between the third quartile and first quartile.
We can take this concept a step further by finding the percentile rank.
Another type of data visualization we'll see soon are stem and leaf plots!


