Função de hastes e folheamentos

Before this, knowQuartis, centris, mediana, mínimos e máximos

Interactive · 1 question

Stem and leaf plots are used to show the frequency with which certain classes of values occur. They are similar to frequency tables or histograms, and are extremely helpful in visualizing the shape of the distribution.

Here is an example of an empty plot:

Empty Stem and Leaf Plot

Image source: By Catherine Yeo

For every number, the leaf is the ones digit, and is placed in the right column of the table. The stem would be the remaining digits (usually just the tens digit), and is placed in the left column of the table (in the row of its corresponding leaf).

Example

"There are 1616 students in a class. The scores of all the students on their final exams were 96,71,78,83,65,89,100,87,69,90,72,85,74,63,94,and 8296, 71, 78, 83, 65, 89, 100, 87, 69, 90, 72, 85, 74, 63, 94, \text{and } 82. Make a stem and leaf plot to show the distribution of the exam scores."

First, let's sort this array of numbers in increasing order: 63,65,69,71,72,74,78,82,83,85,87,89,90,94,96,10063, 65, 69, 71, 72, 74, 78, 82, 83, 85, 87, 89, 90, 94, 96, 100.

What are the stems of these numbers? The stems are the leftmost digits of the data values: 6,7,8,9,and 106, 7, 8, 9, \text{and }10. (For two-digit numbers, the stems are the tens digits. Fo three digit numbers, such as 100,100, the stems contain the hundreds and tens digits.)

What are the leaves for each stem? When the stem is 66, the leaves are 3,5,3, 5, and 99 (because the scores in the range of 60−6960-69 are 6363, 6565, and 6969). When the stem is 77, the leaves are 1,2,41, 2, 4, and 88 (because the scores in the range of 70−7970-79 are 7171, 7272, 74,74, and 7878). When the stem is 88, the leaves are 2,3,5,72, 3, 5, 7, and 99 (because the scores in the range of 80−8980-89 are 8282, 8383, 85,85, 87,87, and 8989). When the stem is 99, the leaves are 0,40, 4, and 66 (because the scores in the range of 90−9990-99 are 9090, 9494, and 9696). When the stem is 1010, the leaf is 00 (because the score in the range of 100−109100-109 is 100100).

Stems __ Leaves
6 ______ 3, 5, 9
7 _______ 1, 2, 4, 8
8 _______ 2, 3, 5, 7, 9
9 _______ 0, 4, 6 
10 _______0

Image source: By Catherine Yeo

Eleven people of different ages attended Barry's birthday party. The ages were 14,9,24,31,4,17,5,48,26,2114, 9, 24, 31, 4, 17, 5, 48, 26, 21, and 1010. How many leaves correspond to a Stem of 1?1?

Choose one answer

Interactive · 3 questions

Stem and Leaf Plots - Construction and Interpretation

A stem and leaf plot is one way to show how often classes of values appear in a data set.

Let's use the dataset below to build a stem-and-leaf plot together.

Heights of Sunflowers in Inches: 13,71,21,20,24,18,40,32,39,11,14,25,35,21,21,19,28,43,52,56,41,29,27\text{Heights of Sunflowers in Inches: } \\ 13, 71, 21, 20, 24, 18, 40, 32, 39, 11, 14, 25, 35, 21, 21, 19, 28, 43, 52, 56, 41, 29, 27

Step One

Before you do ANYTHING, put your data in order from smallest to largest like you do when finding the median or the mode of a data set. For the love of stems and leaves, PUT YOUR VALUES IN ORDER.

Heights of Sunflowers in Inches: 11,13,14,18,19,20,21,21,21,24,25,27,28,29,32,35,39,40,41,43,52,56,71\text{Heights of Sunflowers in Inches: } \\ 11, 13, 14, 18, 19, 20, 21, 21, 21, 24, 25, 27, 28, 29, 32, 35, 39, 40, 41, 43, 52, 56, 71

Step Two

Fill your plot. Here's how to do it.

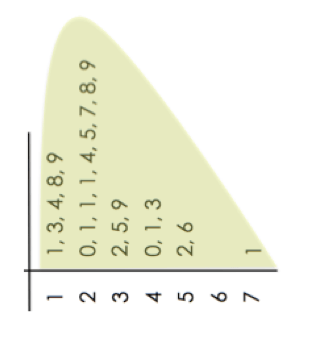
The Stem column contains the non-ones digits in the data set, in ascending order. If the data set only contains two-digit numbers, the stems will be the tens digits of the data values. Also, you cannot repeat stems. Let's look at our data set, and figure out what will be in the Stems column. Our data ranges from 11—71.11 — 71. This means that the tens digits of our data range from 1—7.1 — 7. So, our stems will be 1,2,3,4,5,6,7.\boxed{1}, \boxed{2}, \boxed{3}, \boxed{4}, \boxed{5}, \boxed{6}, \boxed{7}.

The Leaf column contains the ones digit for each data value, in same row as its corresponding tens digit, in ascending order. Remember how you can't repeat stems? Well, you should repeat leaves, if there are duplicate values in your data set. You should have the same number of leaves as you do values in your data set. Let's look at our data set, and figure out what will be in the Leaf column.

The values in our data set with a 11 as a tens digit are 11,13,14,18,19.1\boxed{1}, 1\boxed{3}, 1\boxed{4}, 1\boxed{8}, 1\boxed{9}. So, in the same row as the 11 stem, the leaves are 1,3,4,8,9,\boxed{1}, \boxed{3}, \boxed{4}, \boxed{8}, \boxed{9}, in that order.

The values in our data set with a 22 as a tens digit are 20,21,21,21,24,25,27,28,292\boxed{0}, 2\boxed{1}, 2\boxed{1}, 2\boxed{1}, 2\boxed{4}, 2\boxed{5}, 2\boxed{7}, 2\boxed{8}, 2\boxed{9} So, in the same row as the 22 stem, the leaves are 0,1,1,1,4,5,7,8,9,\boxed{0}, \boxed{1}, \boxed{1}, \boxed{1}, \boxed{4}, \boxed{5}, \boxed{7}, \boxed{8}, \boxed{9}, in that order.

The values in our data set with a 33 as a tens digit are 32,35,39.3\boxed{2}, 3\boxed{5}, 3\boxed{9}. So, in the same row as the 33 stem, the leaves are 2,5,9,\boxed{2}, \boxed{5}, \boxed{9}, in that order.

The values in our data set with a 44 as a tens digit are 40,41,43.4\boxed{0}, 4\boxed{1}, 4\boxed{3}. So, in the same row as the 44 stem, the leaves are 0,1,3,\boxed{0}, \boxed{1}, \boxed{3}, in that order.

The values in our data set with a 55 as a tens digit are 52,56.5\boxed{2}, 5\boxed{6}. So, in the same row as the 55 stem, the leaves are 2,6,\boxed{2}, \boxed{6}, in that order.

In our data, there is no value with a 66 as the tens digit. But, since our data values range from 11—71,11 —71, and 60—6960—69 is in that range, we still have to include a 66 for a stem. It just won't have corresponding leaves. In general, you should include tens digits/stems that are in the range of your data, even if they don't have a corresponding leaf/ones digit.

The value in our data set with a 77 as a tens digit is 71.7\boxed{1}. So, in the same row as the 77 stem, the leaf is 1.\boxed{1}.

Stem and leaf plot of previous data set

Image source: By Hannah Bonville

Which class of values (or range of values) has the greatest frequency in our data set?

Choose one answer

Video · + 1 min read

(Video) How to Make a Stem and Leaf Plot

by MySecretMathTutor

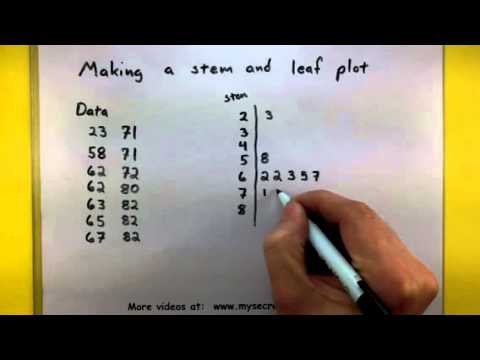
My Secret Math Tutor has a good video that shows you how to construct and analyze stem and leaf plots from a set of data.

Summary\large{\text{Summary}}

Stem and Leaf Plots are a way to organize a set of data. I find that they are the most useful with sets of data where most values are integers that have two digits.

The data set from the video is: 23,58,62,62,63,65,67,71,71,72,80,82,82,8223, 58, 62, 62, 63, 65, 67, 71, 71, 72, 80, 82, 82, 82

The stem column contains the tens place of all of the numbers in the set. The given set has numbers from 2323 to 8282, so the video lists 22 through 88 in the stem column. (Note: if some values in your data set have three or more digits, the stems are the non-ones digits.)

The leaf column has the ones place of each number in the set, in the row of its corresponding tens place. For example, the given set has 62,62,63,67,62, 62, 63, 67, and 6767. This means the leaves for the stem of 66 are 2,2,3,5,2, 2, 3, 5, and 77.

Type a concept, like “slope” or “photosynthesis”.

↑ ↓ to choose · Enter to openSearch explanations and problems