Graficos com continuidade

Before this, knowGraficos discretosO que seria um gráfico?

Video · + 1 min read

(Video) Discrete vs. Continuous Relationships

by Friendly Math 101

Here's a video by Friendly Math 101 going over the differences between continuous and discrete graphs.

Summary\large{\text{Summary}}

Discrete means something that cannot be broken down into fractions or decimals. An example would be people; you cannot have half a person. We typically say discrete things can be counted.

Continuous is something that can and must be able to be broken down into fractions and decimals. Continuous situations are said to be measured, we can measure them. An example of this would be height.

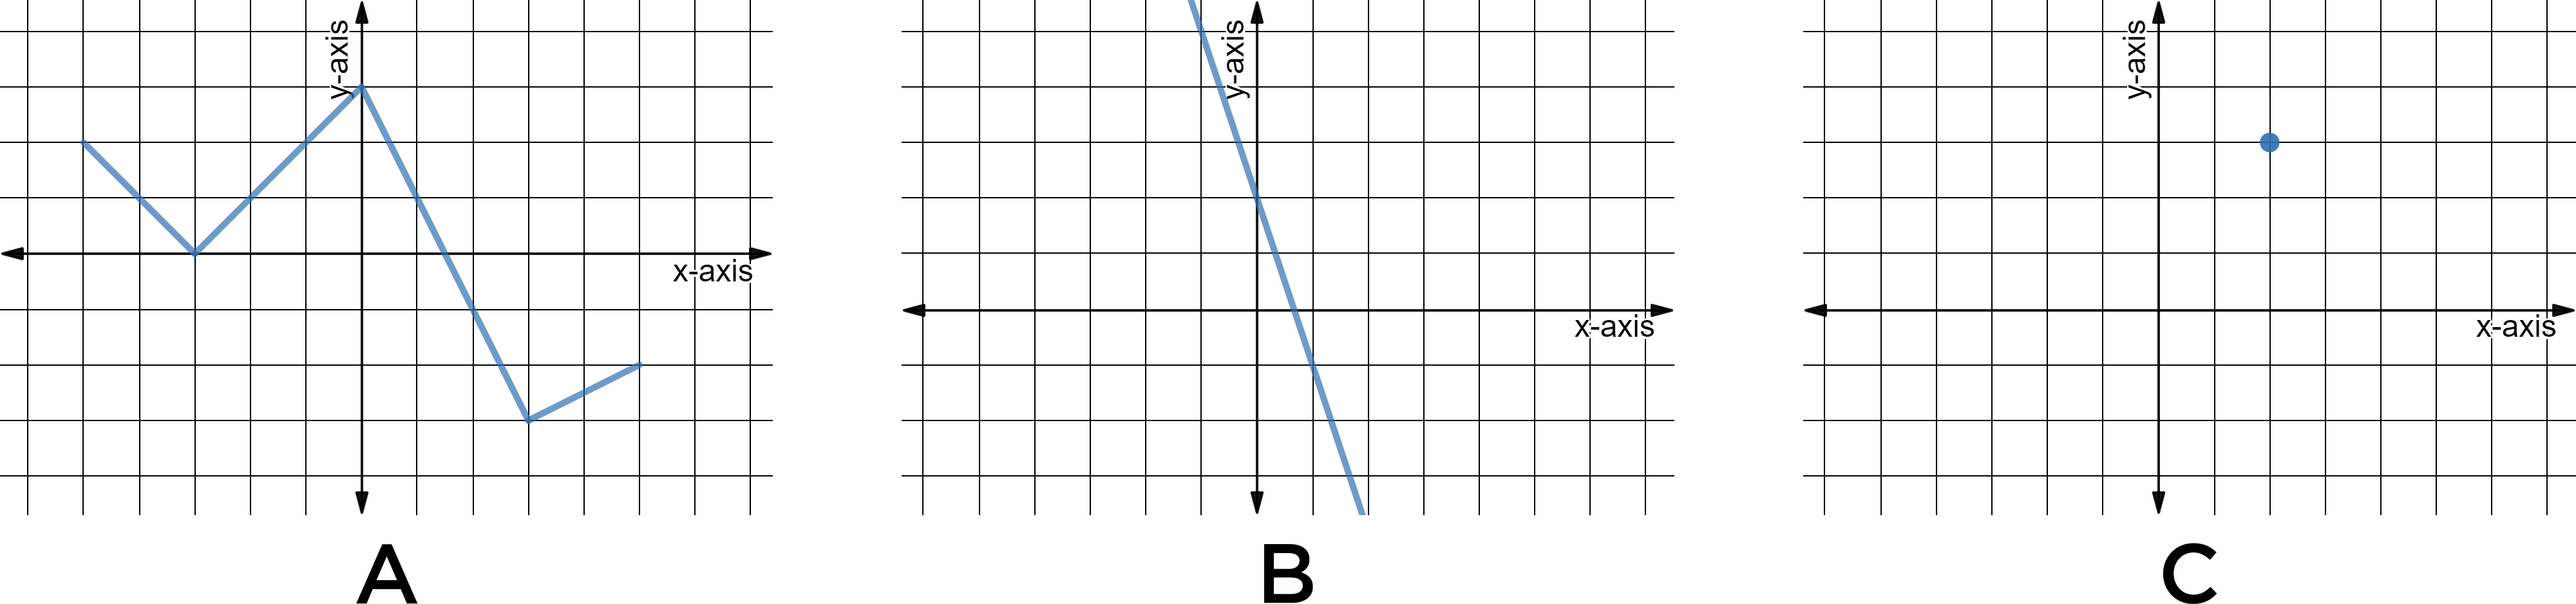
When figuring out if a graph is continuous or discrete we see if all the points are connected. If the line is connected between the start and the end, we say the graph is continuous. If the points are not connected it is discrete. Think about it, can you draw a line between the points? If you can, you've got a continuous function!

Let's practice by looking at the graphs she presents in the video!

Similar to a cube root graph with an open circle at one end and a closed circle at the other.

Made using Desmos

Is this graph continuous or discrete?

Choose one answer

Interactive · 3 questions

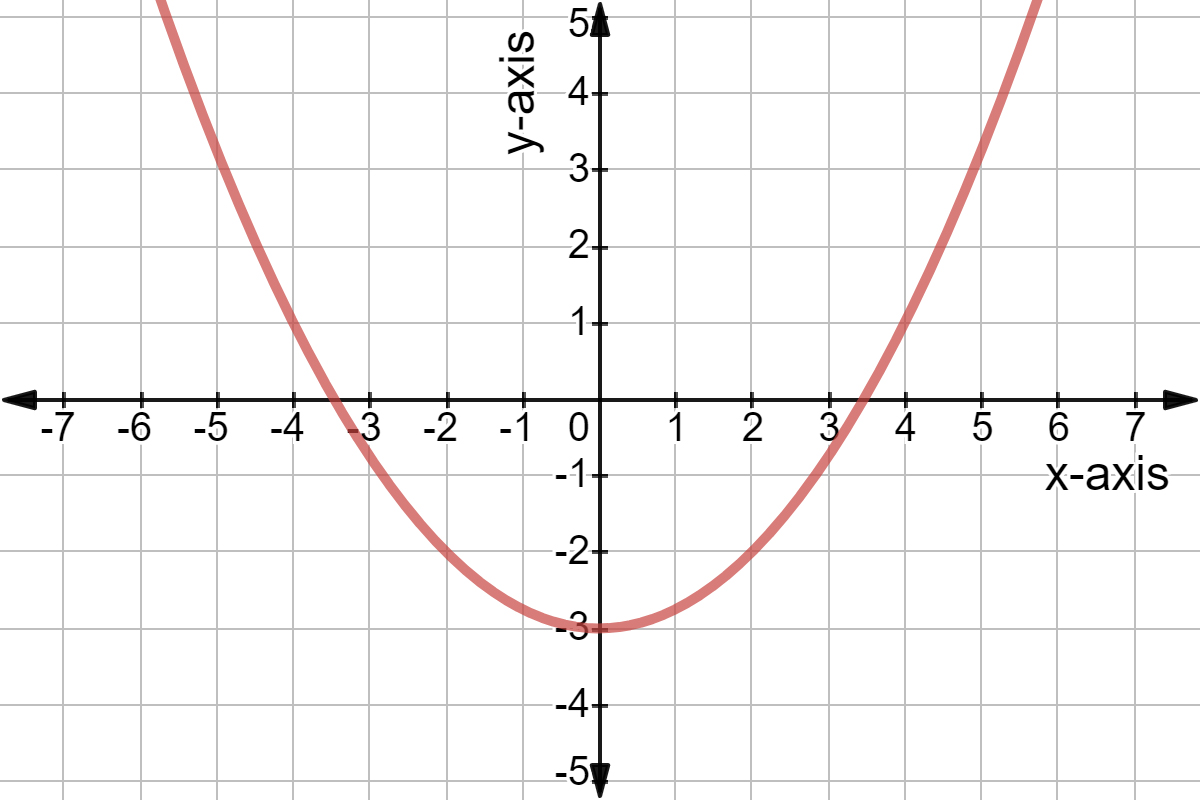
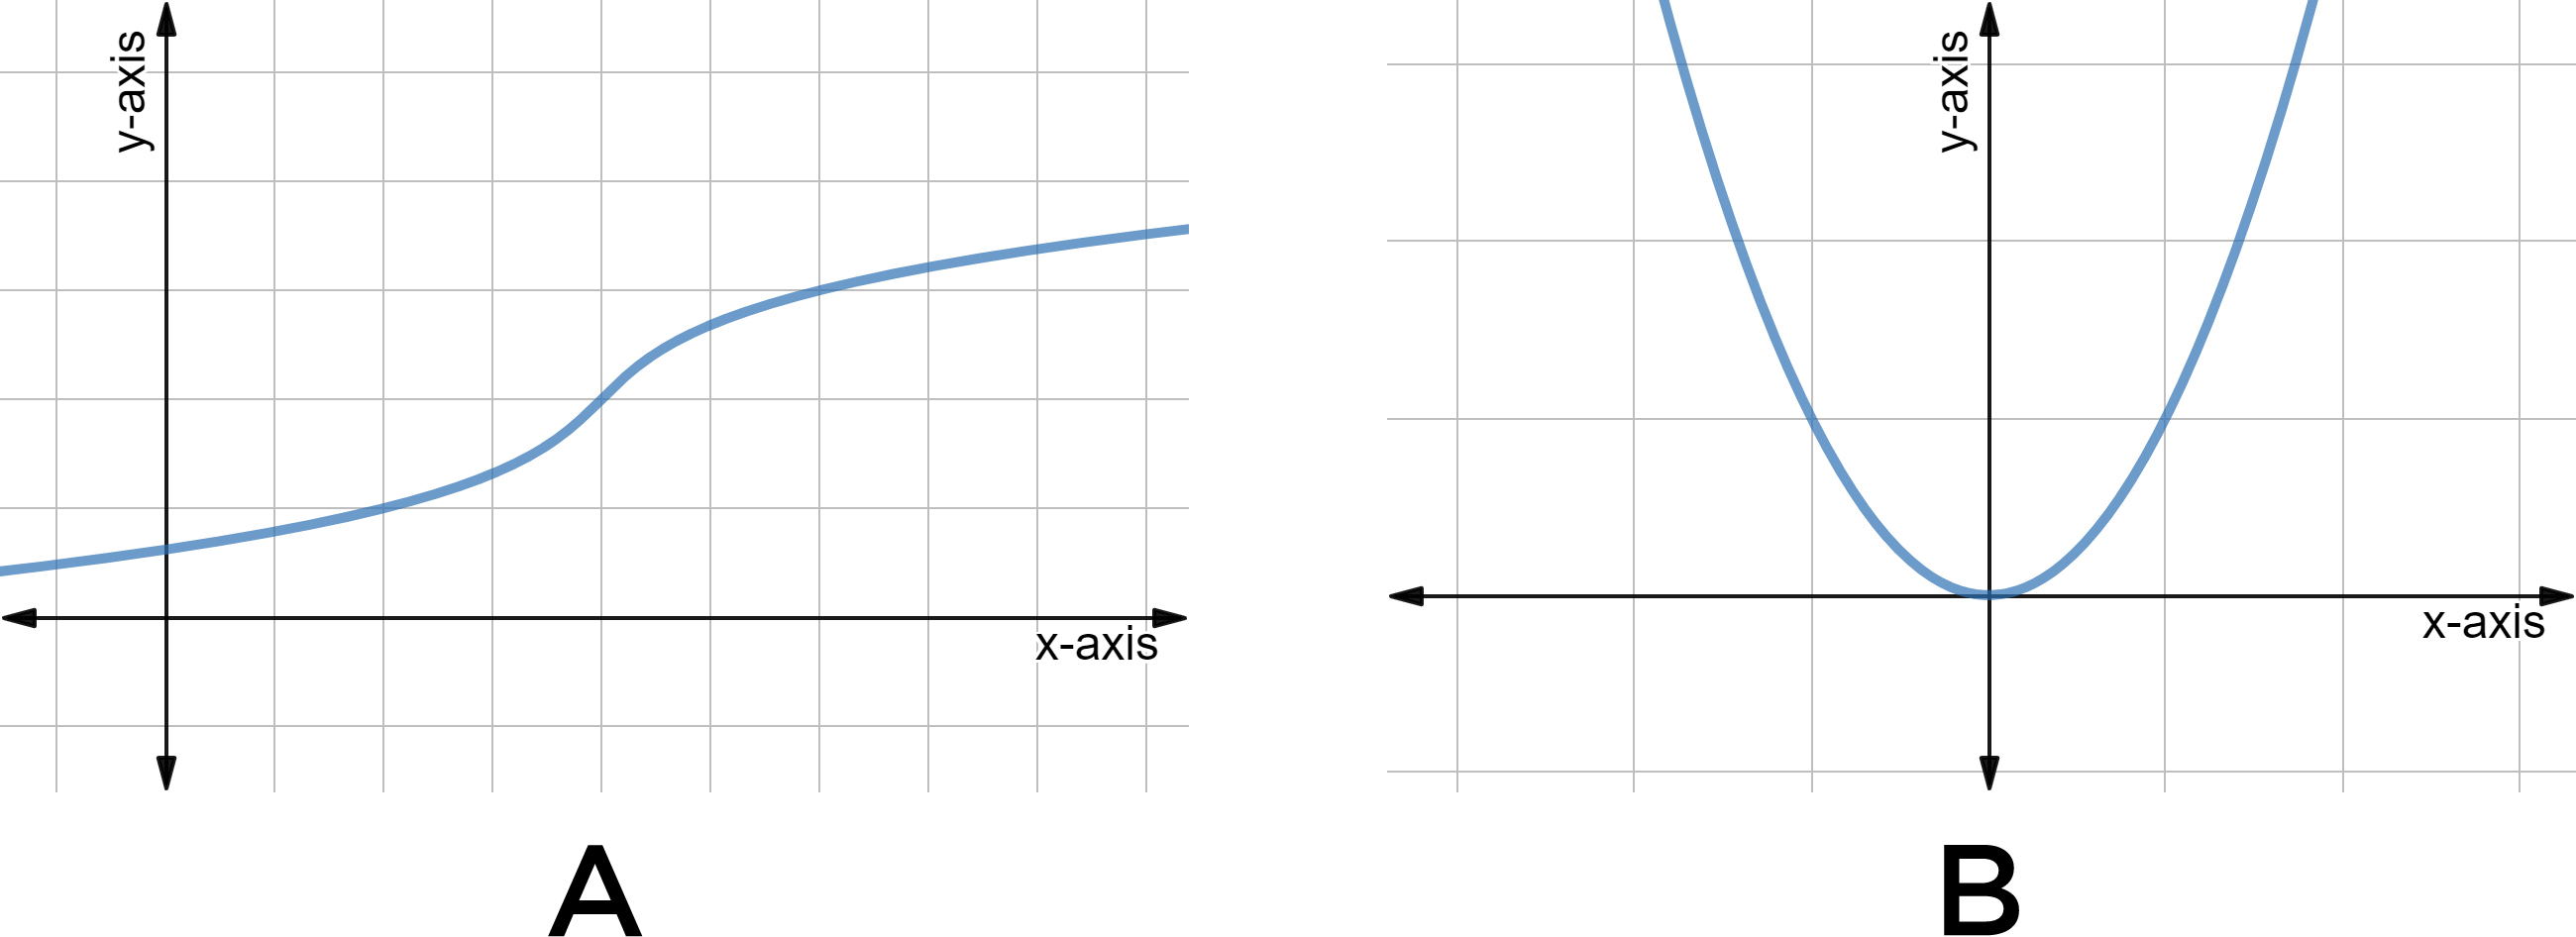
What is a continuous graph?

Continuous graphs have continuous lines. This makes them different from discrete graphs, which only include unconnected points.

A graph that goes up and down.

This is an example of a continuous graph—we've got a continuous line instead of individual points.

Made using Desmos

Continuous graphs represent continuous data. These are data that cover whole intervals. Something like time can be broken down into infinitely small increments: hours, minutes, seconds, milliseconds, microseconds, nanoseconds, and on and on. This is why we can represent it as a line.

The same is true for things like weight. We can break that down into infinitely small increments: kilograms, grams, milligrams, micrograms, etc.

Check off all examples of continuous data from the list below.

Choose all correct answers

Illustrated · 2 min

What are Continuous Graphs?

Continuous graphs are graphs where there is a value of yy for every single value of xx, and each point is immediately next to the point on either side of it so that the line of the graph is uninterrupted. In other words, if the line is continuous, the graph is continuous. For example, the red line and the blue line on the graph below are continuous. The green line is discontinuous.

Blue graph; 2sin(x) + 6, Red graph: x/2 - 1/2, Green graph: 3*floor(1/5*x - 1/3) - 6.5

Made using Desmos

The red and blue lines do not have any breaks in them. That means you can draw the red and blue lines without picking up your pencil. In contrast, you have to pick up your pencil to draw the green lines, so it is discontinuous.

The above lines are called functions, because there is one yy value for every xx value. The red line is a linear function, and the blue line is a non-linear function. To learn more about linear and non-linear functions, click here.

Let's look more closely at discontinuous graphs. The graphs below are all discontinuous (i.e., they are not smooth).

Blue: graph of 2sin(x) + 6 except between -pi and -pi/2; Green: graph of -3*floor(1/5*x-1/3)-6.5; Red: graph of x/2 - 1/2 with a hole at x = (6, 5/2)

Made using Desmos

Graph A (blue) is discontinuous because there's simply a chunk missing. Graph B (red) is discontinuous because even though it APPEARS to be full, there's a point missing (denoted by the empty circle). Graph C (green) is also discontinuous, even though there is a value of yy for every value of xx, since not all the values of yy right next to each other.

On the other side of things, if a graph doesn't have any lines on it at all and is just made up of a bunch of separate points (discrete data), it can be called discrete. Learn more about how discrete graphs differ from continuous graphs!

Discrete and continuous data are not good or bad - they represent different types of numbers and measurements! Different types of values will need different types of graphs. When evaluating functions, you will be able to tell whether your graph will be a continuous or discrete graph.

You will often use continuous graphs to estimate values and solutions for functions.

Type a concept, like “slope” or “photosynthesis”.

↑ ↓ to choose · Enter to openSearch explanations and problems