
Estimando possiveis soluções

Before this, knowO que seria um gráfico?

Illustrated · 1 min

To estimate a possible solution to an equation, you can always look at the graph. We can estimate different features in order to create the equation of the function.

Let's take the equation y=x2y=x^2. Here's what the graph looks like.

Graph of y = x^2.

Made using Desmos

Okay so what if I asked you to find the value of y=x2y=x^2 when x=2.7824x=2.7824? Well I certainly can't do that in my head, and I don't have a calculator near me. But I can estimate the value by looking at the graph. We are essentially going to find the corresponding yy value to our xx value by reading the graph!

This looks like a quadratic function. First let's find x=2.7824x=2.7824 on the xx-axis.

2.7824 is highlighted on the x-axis.

Made using Desmos

Here's roughly where x=2.7824x=2.7824 is on the xx-axis. Now we have to move up in a straight line until we reach our graph.

The point moved up to the graph.

Made using Desmos

And now we just have to move in a straight line towards the yy-axis and see what number it lands on.

The point moved over to the y-axis.

Made using Desmos

As you see it lands around 7.57.5. So we can say that when y=x2y=x^2 where x=2.7824x=2.7824 that y≈7.5y\approx7.5. If you want to be a little more accurate you can notice x=2.7824x=2.7824 is a little above x=2.75x=2.75. So you can choose a yy value a little above 7.57.5. Let's say 7.687.68.

And hey look I found my calculator. Let's see what the actual answer is and see how close we were. If y=x2y=x^2 where x=2.7824x=2.7824 then y=7.74174976y=7.74174976. As you can see both y=7.5y=7.5 and y=7.68y=7.68 were fairly close.

Be careful though. While estimations might be helpful for some quick calculations, it's always best to be as accurate with your numbers as much as possible. This method is good for approximations, or if you're looking for a way to double check your work, but it does not provide an accurate number. Even if the value you found is right on a line, it is always good practice to double check with exact calculations.

Illustrated · 1 min

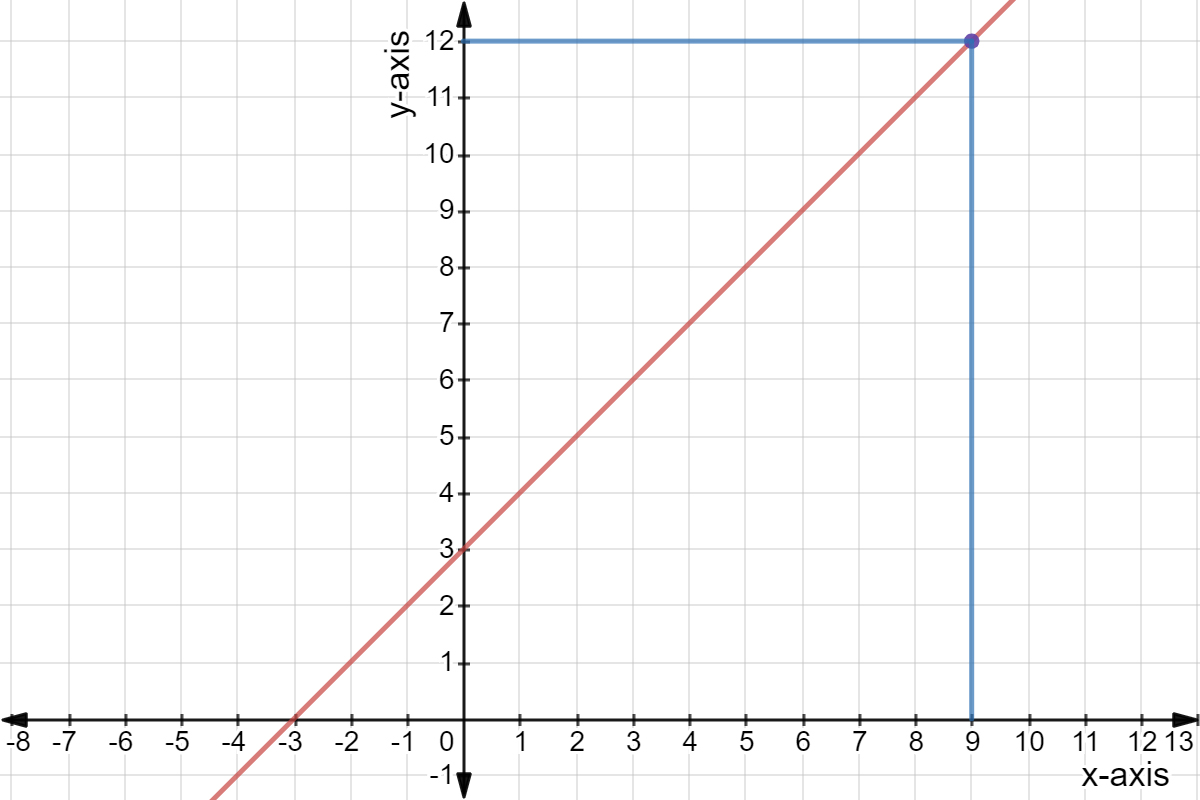
Functions describe the relationship between unknowns. For example: y=x+3y=x+3 This is a function, it describes the relationship between xx and yy. We can say that three more than xx is yy!

We can plot, or graph, functions to help up visualize the functions, which in turn helps us estimate possible solutions.

What is yy when xx is 99? We can calculate it, but we can also graph it and estimate the solution.

Graph of y = x + 3.

Made using Desmos

Find the point on the function (in red) where x=9x = 9, and estimate what yy value it corresponds to.

The point (9,12) highlighted.

Made using Desmos

Draw a line from the point on the line to the corresponding yy value. Make sure your line is straight!

In this case, y=12y=12.

This is a very quick and simplified explanation of functions and graphing functions. You can learn more in depth knowledge on functions and graphing functions.

Video · + 1 min read

(Video) Finding function values given a graph

by Bethany M.

In this video, Bethany discusses how to find values or solutions of a graph given and xx value.

Summary\large{\text{Summary}}

The steps to finding these solutions are:

  1. Find the xx-value on the graph.
  2. Go up or down on the xx-value until you hit the graphed function.
  3. Go across to the yy-axis to find the yy-value that corresponds with the xx-value that is given.

First, we find f(1)f(1). By following those steps, we see that f(x)=9f(x)=9

Next, we find f(−4)f(-4). Again, following the steps, we see that f(x)=−4f(x)=-4

We also see that these solutions or yy-values that correspond to xx are the same as ordered pairs on the graph.

Lastly, when we find f(−7)f(-7), we see that there is a hole in the graph. So, the solution there is undefined.

Look at the rest of the video to work through a harder example.

We can also estimate a value or solution just looking at the equation. Say we have the equation 12=6.023842x+2.3415012=6.023842x+2.34150. What is the estimated solution for xx?

To do this, we can simplify 6.0238426.023842 to 66 and 2.341502.34150 to 22. 12=6.023842x+2.3415012≈6x+212 − 2≈6x+2 − 210≈6x10⁶≈6x653≈xx≈1.5\begin{align} 12&=6.023842x+2.34150\\ 12&\approx6x+2\\ 12\,\color{#8925AE}{-\,2}&\approx6x+2\,\color{#8925AE}{-\,2}\\ 10&\approx6x\\ \frac{10}{\color{#29A603}{6}}&\approx\frac{6x}{\color{#29A603}{6}}\\ \frac53&\approx x\\ x&\approx1.5 \end{align}

If we wanted the most accurate value, we would leave 6.0238426.023842 as the slope and 2.341502.34150 as the yy-intercept, but simplification makes the equation easier to handle.

Illustrated · 1 min

Solutions to Equations with Graphing

When a variable is solved for in an equation, the solved value of the variable is what we call a solution. A solution in math satisfies the equation, therefore making the equation true. Often times, the solution of an equation is where the graph crosses the xx-axis.

Example 11

What is the solution of x=4+5x=4+5?

To find this solution, we would just add 4+54+5 to get x=9x=9. We can graph this to visualize which xx values satisfy the equation.

Graph of x = 9.  It is a line perpendicular to the x-axis and crossing the x-axis at 9.

Made using Desmos

Example 22

What is the solution to y=x+2y=x+2?

We would plug in 00 for yy and solve for xx. This gives us 0=x+20 = x +2, which we can solve to get a solution of x=−2x = -2. Look at the graph below and notice that the graph crosses the xx-axis at x=−2x=-2.

Graph of y = x + 2.  The line crosses the x-axis at -2.

Made using Desmos

Example 33

What is the solution to y=xy=\sqrt{x}?

To find this out we can plug in 00 for yy or look at the graph. We see that the graph crosses the xx-axis at x=0x=0.

Graph of y = sqrt(x).  The line crosses the x-axis at 0.

Made using Desmos

Solutions to Inequalities

When a variable is solved for in an inequality, we also call that a solution. Remember, a solution in math satisfies the equation. When discussing inequalities, there can be multiple solutions that satisfy the equation.

Example 11

What is the solution of x+4<5x + 4<5?

To find this solution, we first want to isolate the xx variable. We can successfully do this by subtracting 44 from both sides to isolate the variable xx to the left side of the equation (because of the Addition and Subtraction Property of Equality). x+4<5x+4 − 4<5 − 4x<1\begin{align} x + 4 &< 5\\ x + 4 \,{\color{#8925AE}{-\,4}} &< 5 \,{\color{#8925AE}{-\,4}}\\ x &< 1 \end{align} We can graph this to visualize which xx values satisfy the equation.

Graph of x < 1

Made using Desmos

Type a concept, like “slope” or “photosynthesis”.

↑ ↓ to choose · Enter to openSearch explanations and problems

