Interactive · 1 question
+4 contributors



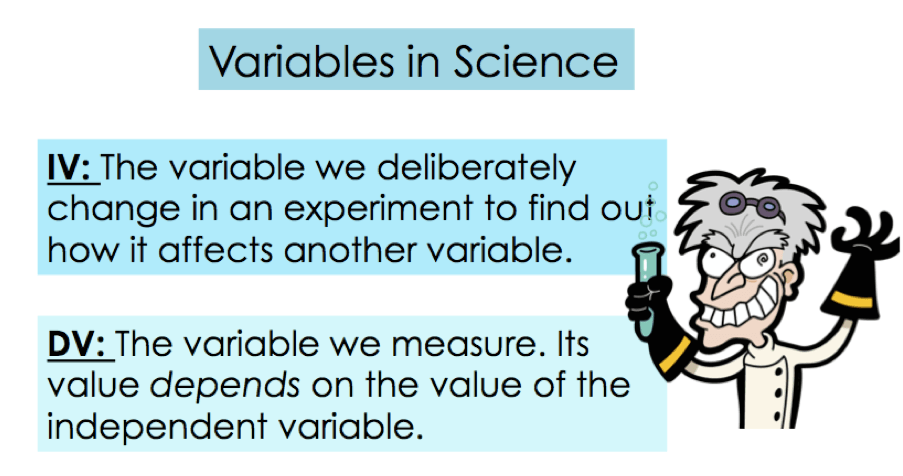
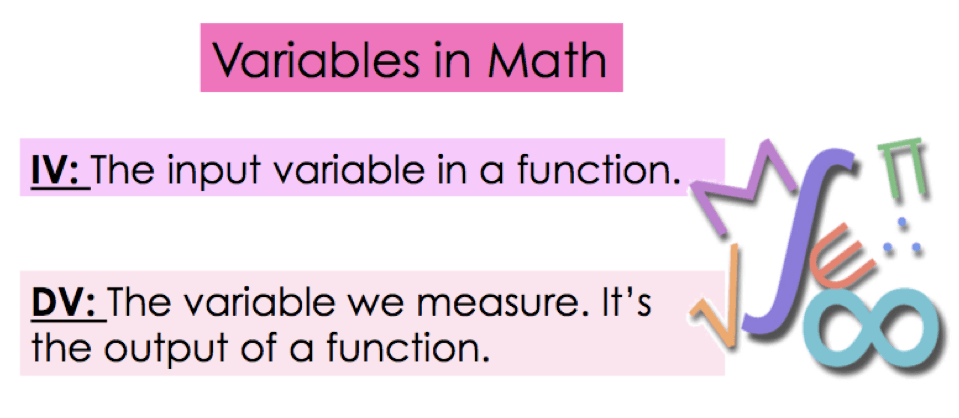
Roughly speaking, independent variables represent function inputs, while dependent variables represent function outputs. The value of a dependent variable depends on what the input is. However, the independent variable does not depend on anything; it is just whatever you want to input! We can examine the relationship between the dependent and independent variables.
But, before we discuss these concepts in detail, we need to know how to represent functions as formulas, which are special kinds of literal equations. That's actually how functions typically arise in word problems and real life: a relationship between an "input variable" (like number of hours worked) and an "output variable" (like amount of income earned), where the input determines the output.
Functions as Formula Equations
The most common way to write a function might be function notation , like in the function rule . The rule tells us that for any input , the output "f of x" of the function will be . For example, while .
Often, a function is instead written as a formula , using one variable (often ) to represent the input and another (often ) to represent the output. For example, the function can be expressed using the formula . Then instead of saying , we could say that when . Or verbally, "the output is when the input is ".
Functions have one output for every input, but the function can be both linear and non-linear.
Note: Formulas are special literal equations that have one variable isolated in terms of the other variables. For example, is a formula for the perimeter of a square in terms of side length, while is a formula for the side length of a square in terms of perimeter.
In literal equation form, functions have two types of numbers in them: constants and variables.
Constants are the numbers that stay the same in the function no matter what. In the equation , the number is a constant.
While 3 doesn't change, it is still attached to the variable. We call these coefficients.
Variables are "placeholders" for numbers that are often unspecified. In the equation form of a function, one variable (representing the output) will often depend on one or more other variables (representing the input).
For example, in the equation from above, when the input value is substituted for , the output value will be , but when the input value is substituted for , the output value will be . The outputs will often (but not always) change as we vary the inputs.
In an equation describing a functional relationship, there are two different kinds of variables.
Independent Variables Represent Function Inputs
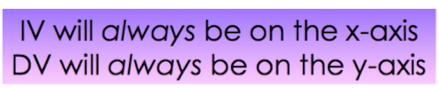
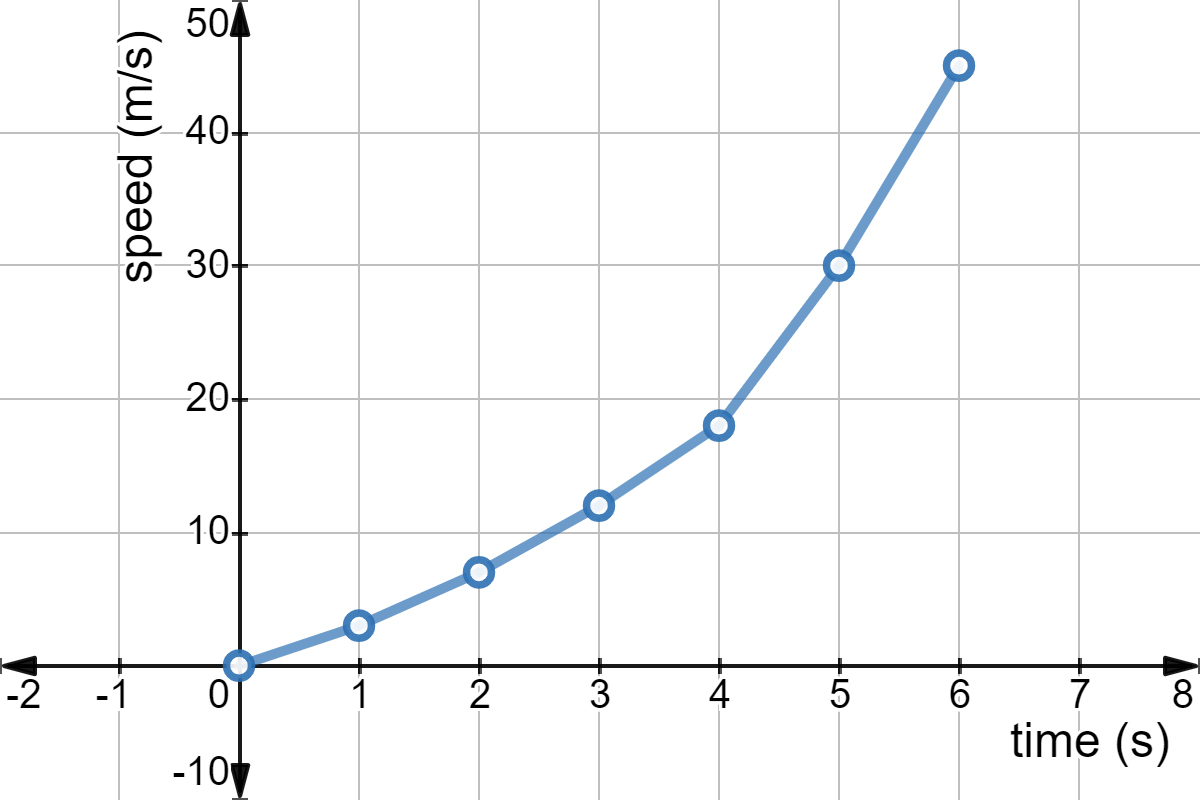
Independent variables are the ones we can freely manipulate, by plugging in any input value. In most math problems, we think of as the independent variable, since it's the one we usually change. We usually plot the independent variable on the horizontal axis of a graph (which we also call the -axis).
Dependent Variables Represent Function Outputs
Dependent variables are determined by independent variables. (This is another way of saying, "a function spits out a single output when you plug in any input".) In most math problems, we think of as the dependent variable and plot it on the vertical axis (which we also call the -axis).
Examples
Let's go back to the equation . Plugging any input value for gives an output value for . In other words, we could say the equation makes the variable a function of the variable . In this functional relationship between and , the variable can be viewed as the independent variable while (whose value "depends" on the value of ) can be viewed as the dependent variable.
Rover Mars receives stars if she recovers baseball plates. Is the number of stars she receives a function of the number of baseball plates she recovers? If so, is the ___ variable and is the ___ variable.
Tables & Graphs
Finally, we can also graph the equation . For example, when the independent variable is , the dependent variable takes the value , so we plot the point (marked in green below). Notice how the horizontal -axis represents the independent variable, while the vertical -axis represents the dependent variable.
Besides graphing, you can also organize pairs into a table, like in the introduction to graphing.
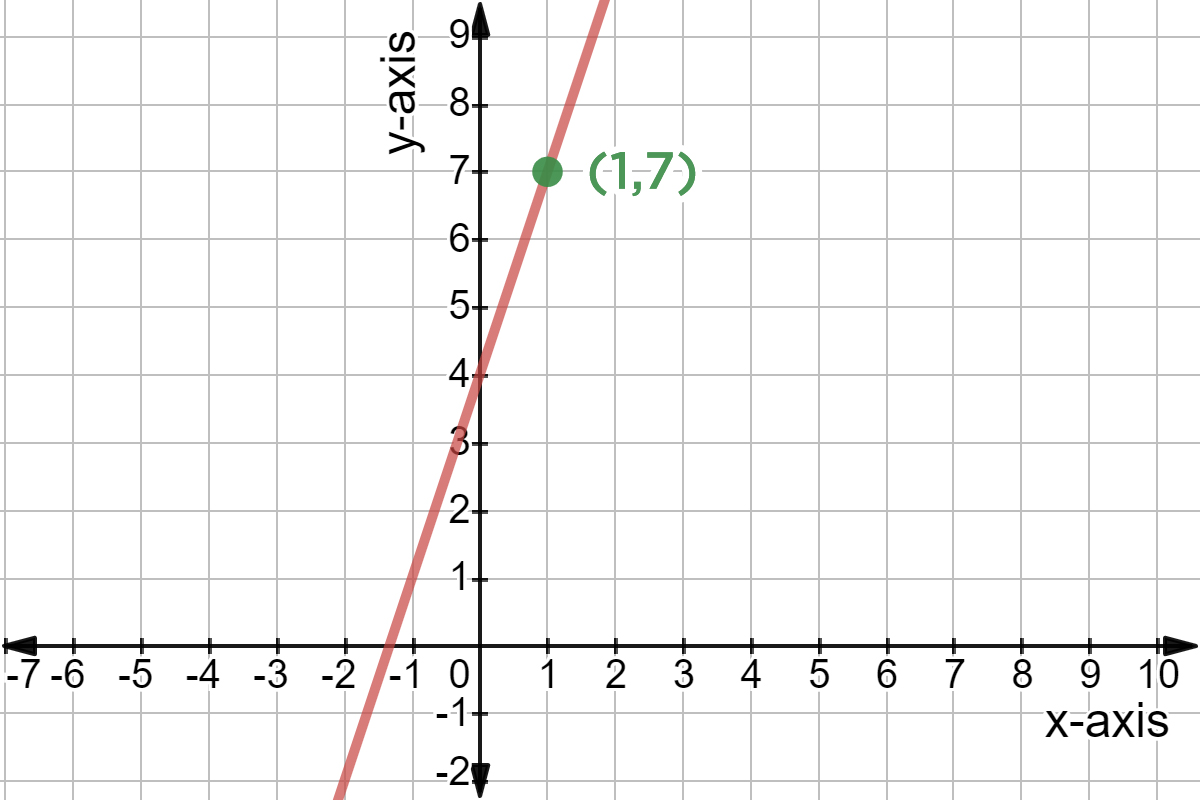
Made using Desmos