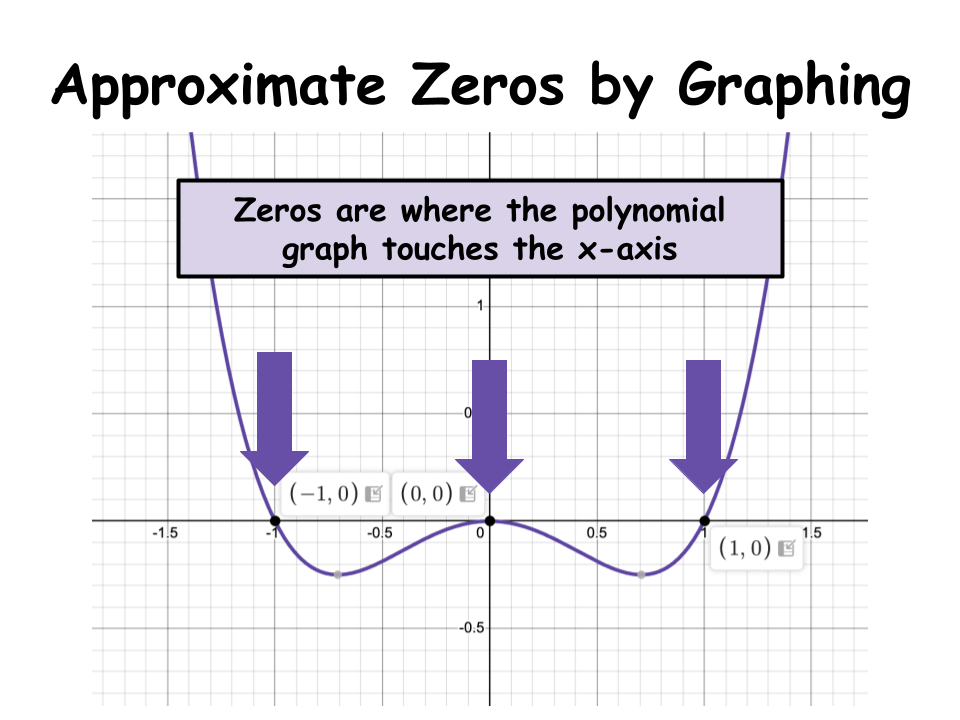
Illustrated · 3 min

Introduction
You may remember that when we use the quadratic formula, we solve for . What we are actually solving for are zeroes!
Zeros
A zero is the -intercept - so zeros are where the function crosses the -axis. This is the point at which .
We've been solving for zeros basically the entire time we've been working with polynomials! Besides using the quadratic formula, we can also factor. In this lesson, we'll learn about how we can use graphing to find zeros!
Before we dive into this next lesson, it may be helpful to get a refresher on the Rational Root Theorem, which used the leading coefficient to find the zeroes of polynomial equations. Once you've done that, dive into this lesson!
Find Zeros by Graphing: Linear Functions
Since we know that zeros are the points at which the function crosses the -axis, we can look at a graph and pinpoint where the function crosses the -axis. That's your zero!

Made using Desmos
The graph above is of . We can see that the function crosses the -axis at the point . This point is also known as the zero of the function.
Find Zeros by Graphing: Quadratic Functions
Let's take this a step further and look at quadratic functions. In previous lessons, you learned how to use the discriminant to find real and complex roots. When a quadratic function only has complex roots, the function never crosses the -axis, so there are no real zeros on the - and -coordinate plane.
A quadratic function with real solutions can have one zero or two zeros. A quadratic function with one zero has its vertex on the -axis.

Made using Desmos
The above graph is of , where the vertex is at the origin, . The function only touches the -axis at one point.
Most of the other quadratic functions you will come across will cross the -axis twice.

Made using Desmos
This is a graph of . The function crosses the -axis at two points, and . Those two points are also our zeros!
Find Zeros by Graphing: Cubic Functions
We can take this one more step further by looking at cubic functions. Cubic functions can have one, two, or three zeros. Unlike quadratic functions, a cubic function will always have at least one zero.

Made using Desmos
The above graph is of the function . The function crosses the -axis at one point, the origin. This point is also its zero!
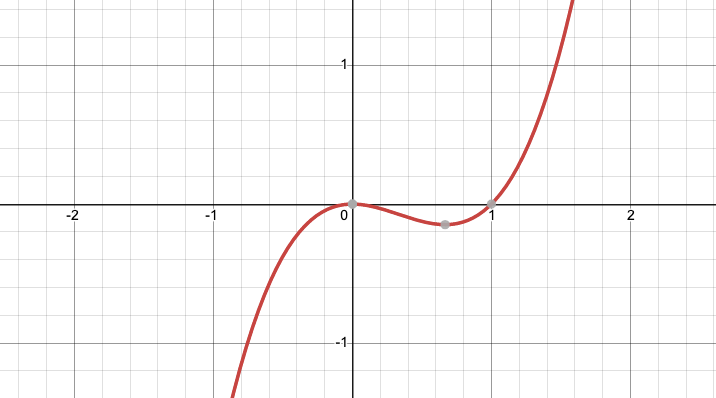
Let's look at a cubic graph with two zeros.
Made using Desmos
This is the cubic function with two real roots, or two zeros. The two zeros are at and .
Lastly, we'll look at a function with three zeros.

Made using Desmos
This is a graph of the function . The function crosses the -axis three times, so it has three zeros at: , , and .
Going Forward
The next lessons will cover other ways to understand zeros of polynomials: The Intermediate Value Theorem and the Fundamental Theorem of Algebra. Once the zeros are known, you can write a polynomial in terms of its roots. Once we know both roots and end behavior, you can graph using those concepts.
This lesson covered only graphing, but there are more mathematical ways of finding zeroes and intercepts. In the future, you may encounter how to find points using a leading coefficient or listing all possible rational values. You may also find it best to just completely factor a function. What we are trying to do is give you numerous tools to be able to tackle these problems.