绘制有理函数图像

Before this, know不连续点渐近线

Read · 2 min

###Learn how to graph rational functions!

Let's look at an example of a rational function: 2x−2x2+3x−4\frac{2x-2}{x^2+3x-4}

The steps to graphing a rational function are:

  1. Factor the numerator and denominator if applicable.

  2. Find any holes.

  3. Find the xx and yy intercepts.

  4. Solve for the vertical asymptote.

  5. Solve for the horizontal asymptote. If applicable, solve for the oblique/slant asymptote.

  6. Using the information you have solved for in the previous steps, graph the function!

While these steps may seem overwhelming, don't worry! We will be going through them step-by-step.

##Factor

Factor both the numerator and denominator. For example:

2x−2x2+3x−4\frac{2x-2}{x^2+3x-4} x2+3x−4=(x−1)(x+4)x^2+3x-4 = (x-1)(x+4)

Therefore, 2(x−1)(x−1)(x+4)\frac{2(x-1)}{(x-1)(x+4)}

##Finding Holes

Holes are an xx value on the graph where both the numerator and denominator are zero.

To find the hole, simply see if there are any factors that cancel.

In the example above, we can see that the factor (x−1)(x-1) is in both the numerator and denominator. We can remove (x−1)(x-1).

2(x−1)(x−1)(x+4)\frac{2\cancel{(x-1)}}{\cancel{(x-1)}(x+4)}

If we set (x−1)=0(x-1)=0, then we know x=1x=1. So, the xx-value of the hole is 1. We solve for the yy-value of the hole by plugging in the xx-value and solving.

y=2((1)+4)=25y = \frac{2}{((1)+4)} = \frac{2}{5}

The hole is (1, 25\frac{2}{5}).

##Finding Intercepts

To find the xx intercepts, set the numerator equal to zero.

For y=2x+4y=\frac{2}{x+4}, there are no xx intercepts as there is no xx in the numerator.

To find the yy intercept, set xx equal to 0.

y=2x+4=2(0)+4=24=12y=\frac{2}{x+4} = \frac{2}{(0)+4} = \frac{2}{4} = \frac{1}{2}

Therefore, the yy intercept is 12\frac{1}{2}

###Solve for the Vertical Asymptote

Solve for the vertical asymptote by setting the denominator equal to zero and solving for the variable. Remember, ignore the hole!

Denominator =x+4=0= x+4 = 0

Therefore, x=−4x =-4, which is the vertical asymptote!

###Solve for the Horizontal Asymptotes

To solve for the horizontal asymptote, there are 33 rules.

  1. If the degree of the numerator is less than the degree of the denominator, the horizontal asymptote is y=0y=0.

  2. If the highest degree of the numerator and denominator are the same, divide the coefficients of the highest degree terms.

  3. If the highest degree of the numerator is greater than the highest degree of the denominator, then there is no horizontal asymptote, there is a slant asymptote.

y=2x+4y=\frac{2}{x+4}, so the horizontal asymptote is y=0y=0. This asymptote will go toward positive and negative infinity.

To find the slant asymptote, divide the numerator by the denominator. You will likely need to use polynomial long division!

Graph all these components together. Start by graphing the vertical and horizontal/slant asymptotes using dashed lines on the graph. Then draw the hole(s) and the intercepts on the graph. Finally, use the asymptotes, the hole(s), and intercepts as guidelines for drawing the function. Plugging in some sample (x,y)(x,y) coordinates can also help you graph!

Video · + 2 min read

(Video) Graphing Rational Functions

by Brian McLogan

In this video by Brian McLogan, you will learn six easy-to-follow steps to graph a rational function.

Summary

To graph a rational function, there are six steps you need to follow. Follow along with the example to learn the steps!

Example: Graph the rational function, f(x)=x−1x2−x−6f(x) = \frac{x-1}{x^2-x-6}

Step #1: Find the vertical asymptote.

To find the vertical asymptote, we need to set the denominator equal to 00.

x2−x−6=0(x−3)(x−2)=0x=3,−2\begin{align} x^2 -x -6 &= 0 \\ (x-3)(x-2) &=0 \\ x &= 3, -2 \\ \end{align}

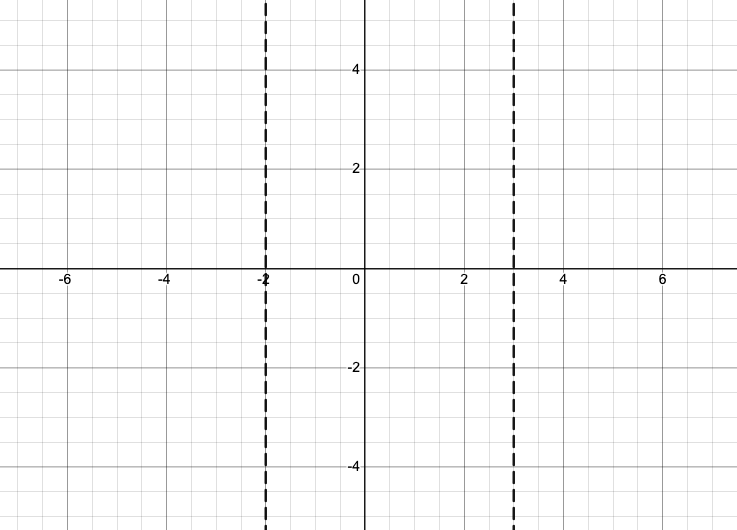
These are our vertical asymptotes! Our graph will not cross these asymptotes. Therefore, we will use a dashed line to represent these asymptotes. These asymptotes are shown in the figure.

Dashed lines at x=3, x=-2

Made using Desmos

Step #2: Find the horizontal asymptotes.

To find the horizontal asymptotes, we need to compare the degrees in the numerator to the degrees in the denominator. The degree of the numerator is 11, and the degree of the denominator is 22. We know that 1<21<2, which means that there is a horizontal asymptote y=0y=0. We will represent this horizontal asymptote with a dashed line.

Dashed lines at x=3, x=-2, and y=0.

Made using Desmos

Step #3: Find the slant asymptotes.

We don't have slant asymptotes!

Step #4: Determine the xx intercepts.

The xx-intercept is when y=0y=0.

0=x−1x2−x−60⋅x2−x−61=x−1x2−x−6⋅x2−x−610=x−1x=1\begin{align} 0 &= \frac{x-1}{x^2-x-6} \\ 0 \cdot \frac{x^2-x-6}{1} &= \frac{x-1}{x^2-x-6} \cdot \frac{x^2-x-6}{1} \\ 0 &= x-1 \\ x &= 1 \end{align}

Step #5: Determine the yy intercepts.

The yy-intercept is when x=0x=0.

f(x)=x−1x2−x−6f(x)=0−102−0−6f(x)=16\begin{align} f(x) &= \frac{x-1}{x^2-x-6} \\ f(x) &= \frac{0-1}{0^2-0-6} \\ f(x) &= \frac{1}{6} \\ \end{align}

Let's graph both the xx and yy intercepts on our graph in purple.

Asymptotes with intercepts

Made using Desmos

Step #6: Check symmetry.

If f(−x)=f(x)f(-x)=f(x), then we have symmetry along the yy-axis. If f(−x)=−f(x)f(-x)=-f(x), then we have symmetry along the origin. If Let's test this out:

f(−x)=−x−1(−x)2−(−x)−6f(-x) = \frac{-x-1}{(-x)^2-(-x)-6}

If we think about it, we don't have to do much math! In our numerator, the xx value is negated, but the sign on the constant, negative, is still the same. Therefore, our numerators won't be the same, but they also won't be negated. There's no symmetry. This is neither an even nor an odd function.

All that's left is to plot points! We will create a table of points, based on the information we found above, including vertical and horizontal asymptotes and the intercepts.

Some points we could plot are: x=−1,−3,−4,4,5x=-1, -3, -4, 4, 5.

f(−1)=0.5f(−3)=−2.66f(−4)=−0.35f(4)=0.5f(5)=0.28\begin{align} f(-1) &= 0.5 \\ f(-3) &= -2.66 \\ f(-4) &= -0.35 \\ f(4) &= 0.5 \\ f(5) &= 0.28 \\ \end{align}

Our graph looks like:

Graph of f(x)=\frac{x-1}{x^{2}-x-6}\left\{\ -2<x<3\right\}

Made using Desmos

Illustrated · 1 min

Graphing Rational Functions

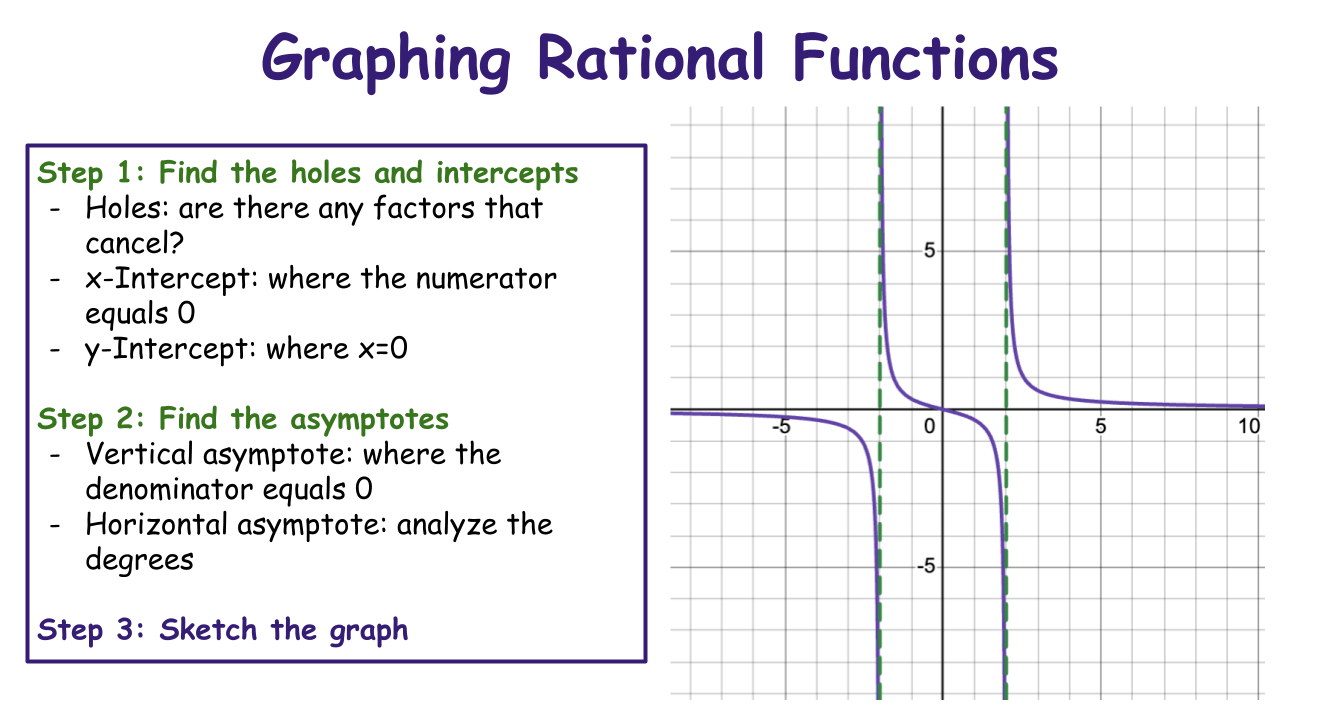
In this lesson, we are going to learn how to graph rational functions. A rational function is a fraction with polynomials on the top and bottom.

Graphing Rational Functions
Step 1: Find the holes and intercepts
Holes: are there any factors that cancel?
x-Intercept: where the numerator equals 0
y-Intercept: where x=0

Step 2: Find the asymptotes
Vertical asymptote: where the denominator equals 0
Horizontal asymptote: analyze the degrees

Step 3: Sketch the graph

Made using Desmos

Let's look at f(x)=x+1x−2f(x)=\frac{x+1}{x-2}.

The graph of this function has asymptotes (invisible lines that graph gets close to but never actually touches). The vertical asymptote happens when the bottom equals zero. For our example, that's when x=2x=2.

There may also be a horizontal asymptote, which tells us how the graph behaves when xx gets really big or really small. To find it, we compare the degrees of the top and bottom. If they are the same, divide the leading coefficients.

Type a concept, like “slope” or “photosynthesis”.

↑ ↓ to choose · Enter to openSearch explanations and problems