两个(或多个)函数的复合仍然是函数

Video · + 1 min read

(Video) Translating Absolute Value Functions

by Keith Mann

There are two ways we will learn to translate a function: Horizontal and Vertical. Keith Mann explains both. Skip to 3:203:20 for vertical translations. Skip to 6:006:00 for horizontal translations.

Summary\large{\text{Summary}}

This video explains both vertical (f(x)=∣x∣→g(x)=∣x∣−5)(f(x) = |x| \rightarrow g(x) = |x|-5) and horizontal translations (f(x)=∣x∣→h(x)=∣x+1∣)(f(x) = |x| \rightarrow h(x) = |x+1|) of absolute value functions.

For a challenge, let's compose these translations so that our new function is shifted 55 units down and 11 unit left!

First, let's translate the original absolute value function, f(x)=∣x∣f(x)=|x|, five units down. This means we move every point on the original absolute function down five units.

Here are the graphs of the functions:
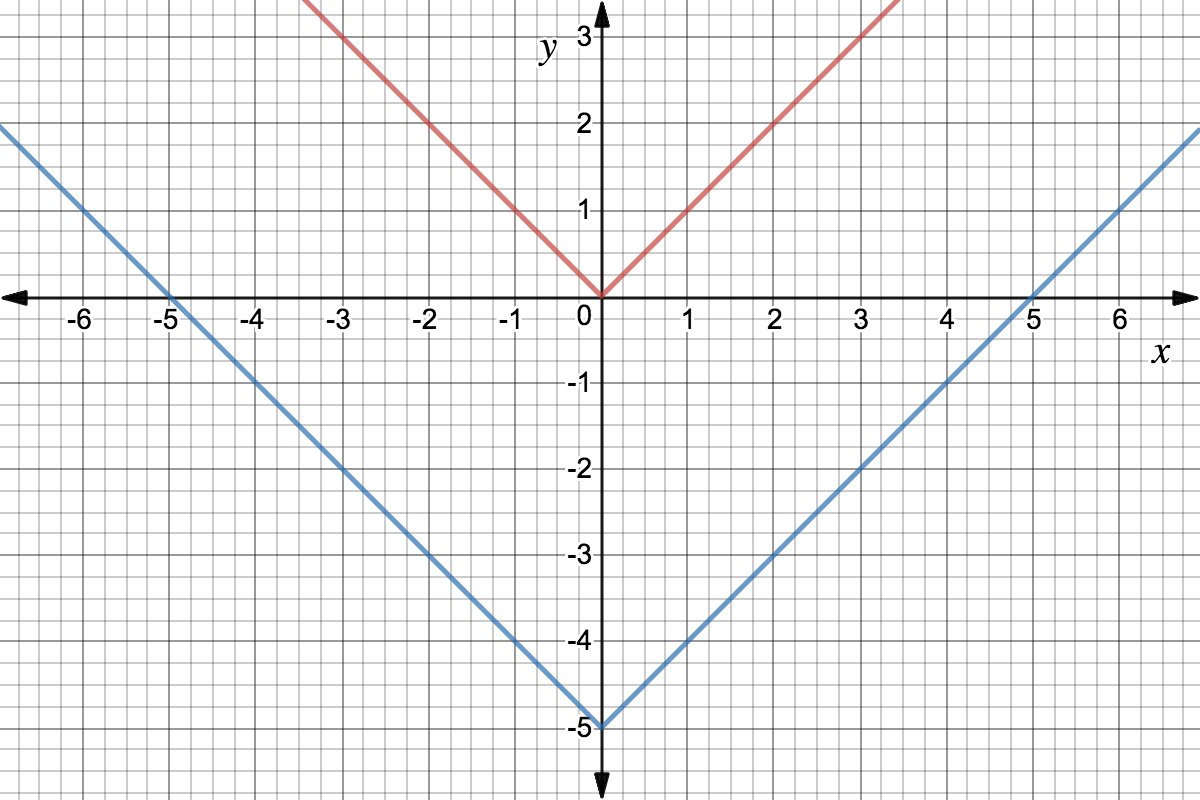
Graph of functions f(x)=|x| in red and g(x)=|x|-5 in blue

Graph courtesy of Desmos

The red function is f(x)=∣x∣f(x)=|x| and the blue function is g(x)=∣x∣−5.g(x)=|x|-5. Notice that g(x)g(x) looks similar to our original function, except it is shifted vertically downward by 55 units.

We can represent vertical shifts downwards by subtracting a positive number from our function outside of the absolute value signs. We can represent vertical shifts upwards by adding a positive number to our function outside of the absolute value signs.

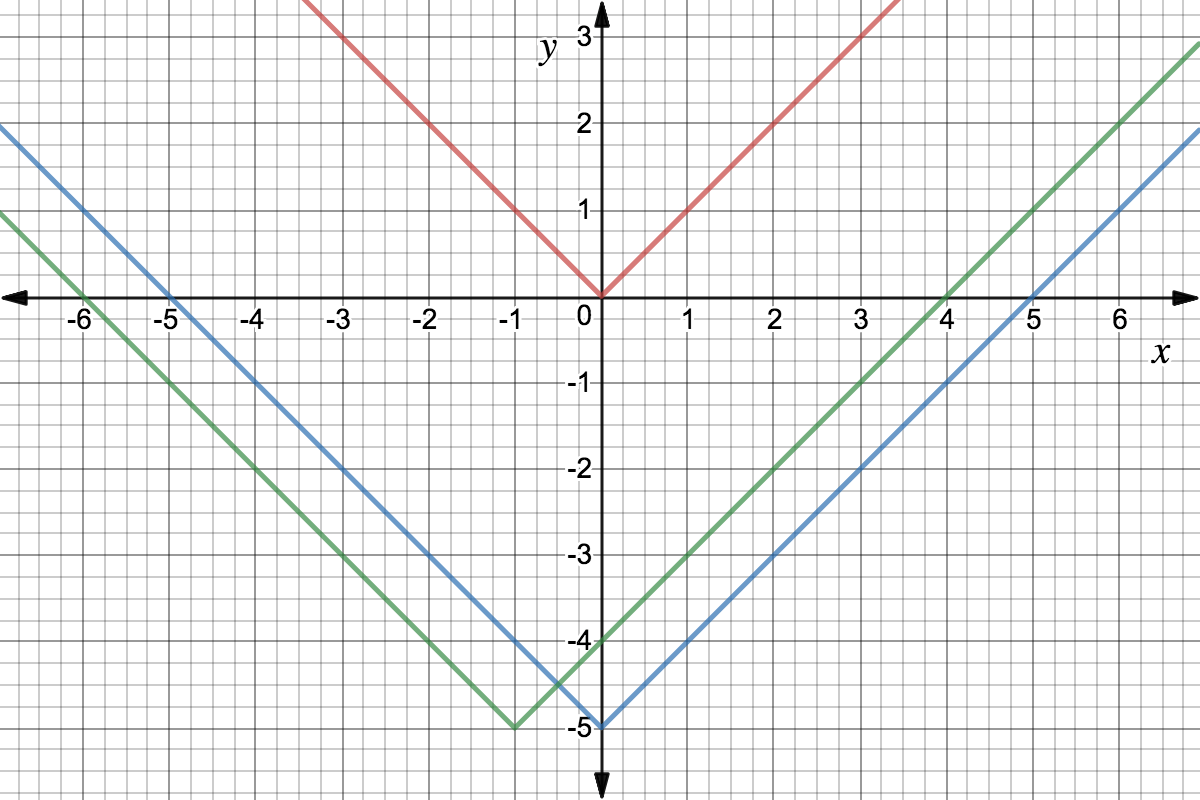
Now, let's translate out new absolute value function, g(x)=∣x∣−5g(x)=|x|-5, one unit to the left. After watching the video, we see that this clearly means we move every point on g(x)g(x) to the left by one unit.

Graph of functions f(x)=|x| in red, g(x)=|x|-5 in blue, and h(x)=|x+1|-5 in green

Graph courtesy of Desmos

The red function, f(x)=∣x∣,f(x)=|x|, and the blue function, g(x)=∣x∣−5,g(x)=|x|-5, are the same as before. We obtained the green function, h(x)=∣x+1∣−5h(x)=|x+1|-5, by horizontally translating g(x)g(x) by one unit to the left. Notice that h(x)h(x) looks similar to our original functions, except its vertex is at (−1,−5)(-1,-5).

When we are working with absolute value functions, we can represent horizontal shifts to the left by adding a positive number to our function inside of the absolute value signs. We can represent horizontal shifts to the right by subtracting a positive number=from our function inside of the absolute value signs.

Illustrated · 2 min

Function Transformation

A function transformation is to move the graph by shifting the axis of the graph, stretch, or compress the graph.

It take the basic function of f(x)f(x) and transforms it, moving the graph around.

There are 66 common types of function transformations: Shift Up or Down:f(x)+cShift Left or Right:f(x+c)Reflect about the x-axis:−f(x)Reflect about the y-axis:f(−x)Stretch or Compress Vertically:cf(x)Stretch or Compress Horizontally:f(cx)\begin{array}{|r|c|c|} \hline \text{Shift Up or Down:}& f(x)+c \\ \hline \text{Shift Left or Right:}& f(x+c) \\ \hline \text{Reflect about the x-axis:}& -f(x) \\ \hline \text{Reflect about the y-axis:}& f(-x) \\ \hline \text{Stretch or Compress Vertically:}& cf(x) \\ \hline \text{Stretch or Compress Horizontally:}& f(cx)\\ \hline \end{array}

Let's take a look at some quadratic functions.

Shift Up or Down

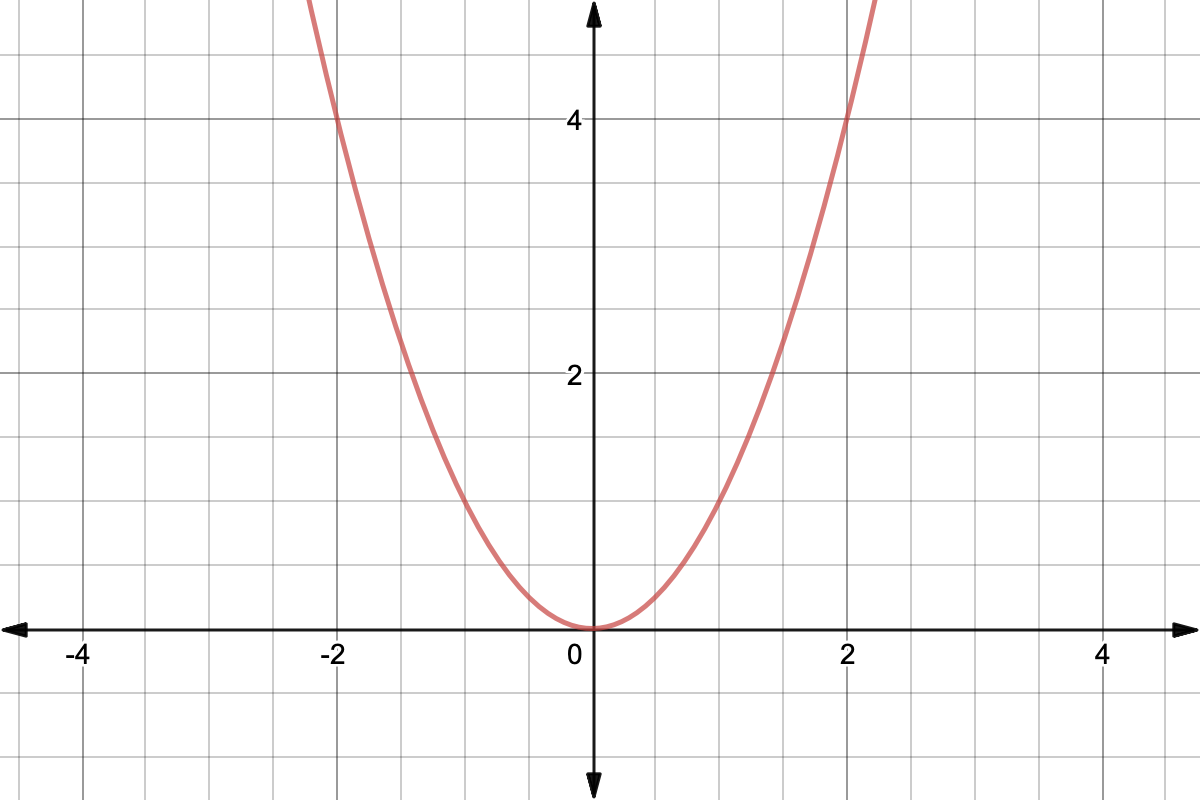
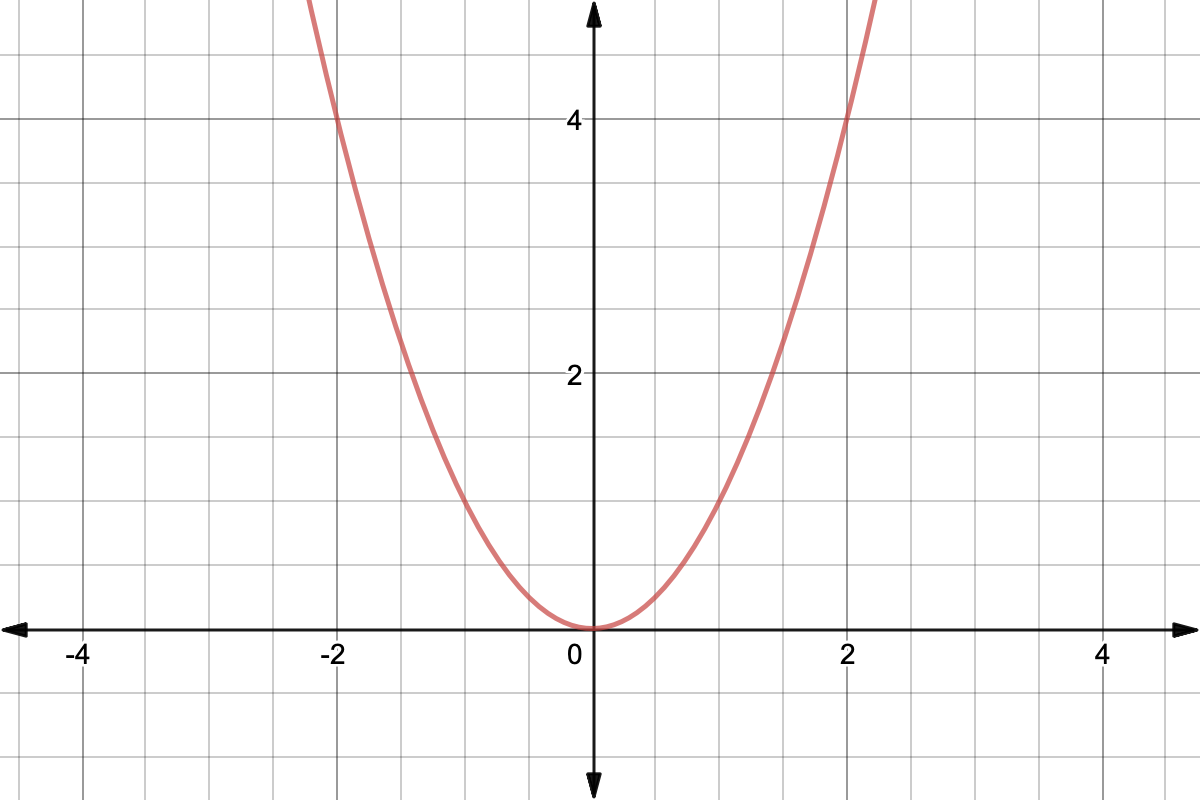
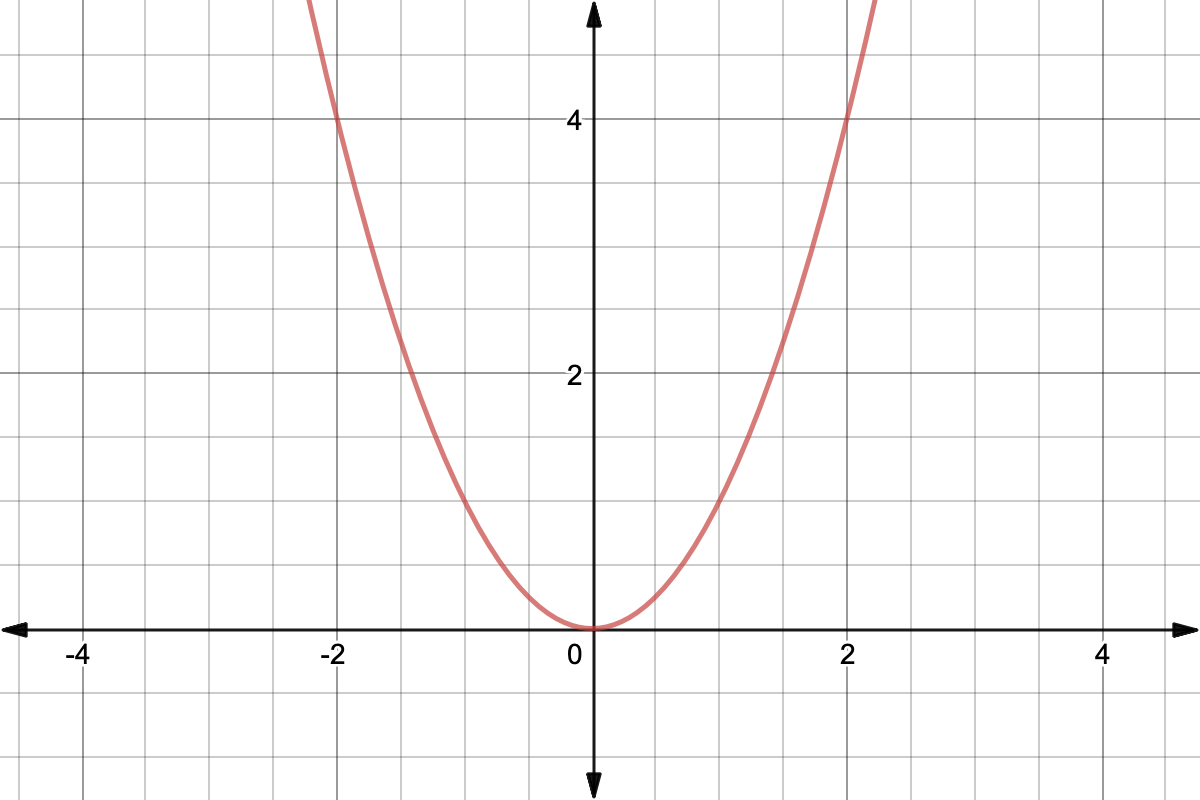
Given the graph of f(x)f(x), f(x)+cf(x)+c will be the graph of f(x)f(x) shifted up by cc if the value of cc is positive and shifted down by cc if the value of cc is negative. \\ Let’s start with the graph of f(x)=x2f(x)=x^{2}. \\

Graph of y=x^2

Graphed with Desmos

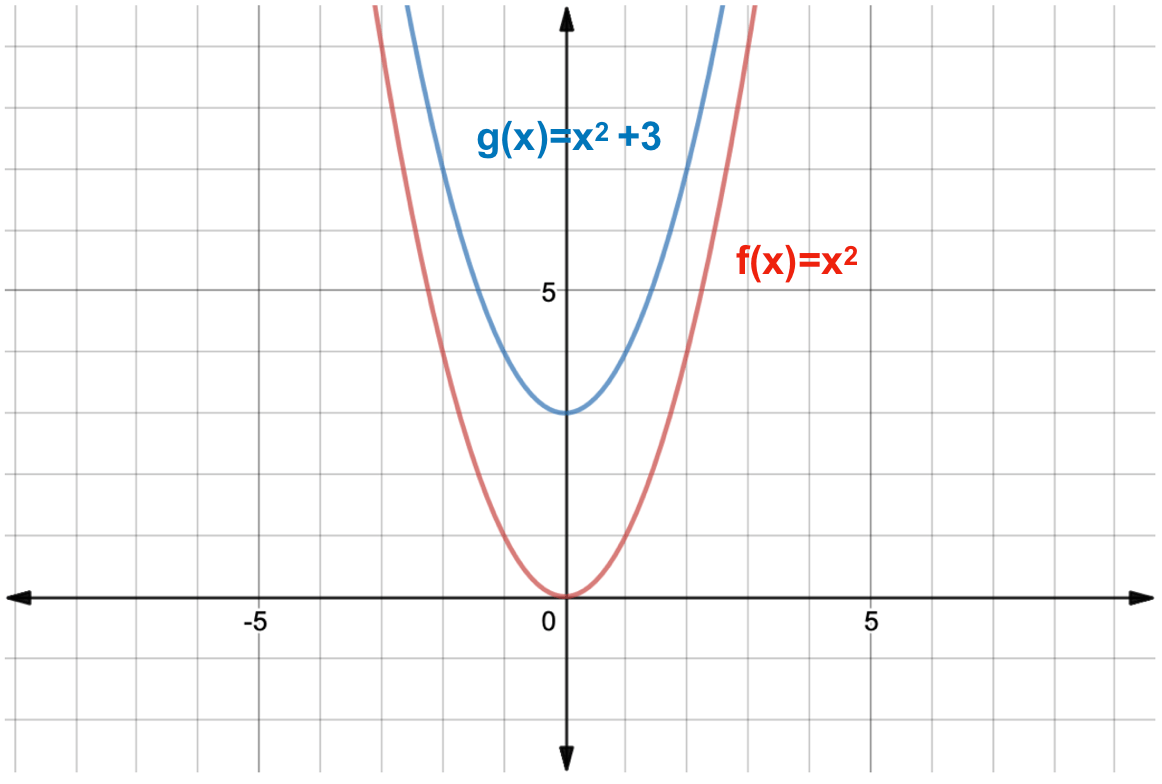
The graph g(x)=f(x)+3=x2+3g(x)= f(x)+3 = x^{2}+3 will be the original graph of f(x)f(x) shifted up 33 units. \\

Graph of y=x^2 and y=x^2+3

Graphed with Desmos

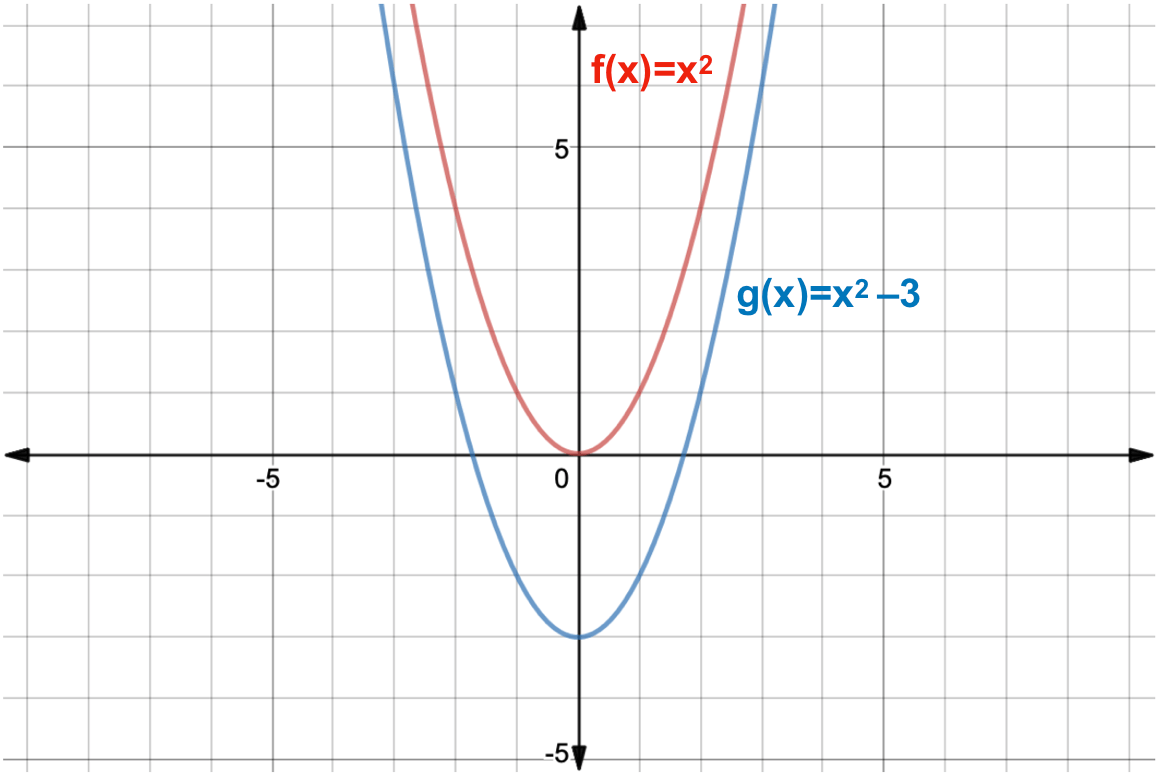
The graph g(x)=f(x)−3=x2−3g(x)= f(x)-3 = x^{2}-3 will be the original graph of f(x)f(x) shifted down 33 units. \\

Graph of y=x^2 and y=x^2-3

Graphed with Desmos

Shift Left or Right

Given the graph of f(x)f(x), f(x+c)f(x+c) will be the graph of f(x)f(x) shifted left by cc if the value of cc is positive and shifted right by cc if the value of cc is negative. \\ Let’s start with the graph of f(x)=x2f(x)=x^{2} again. \\

Graph of y=x^2

Graphed with Desmos

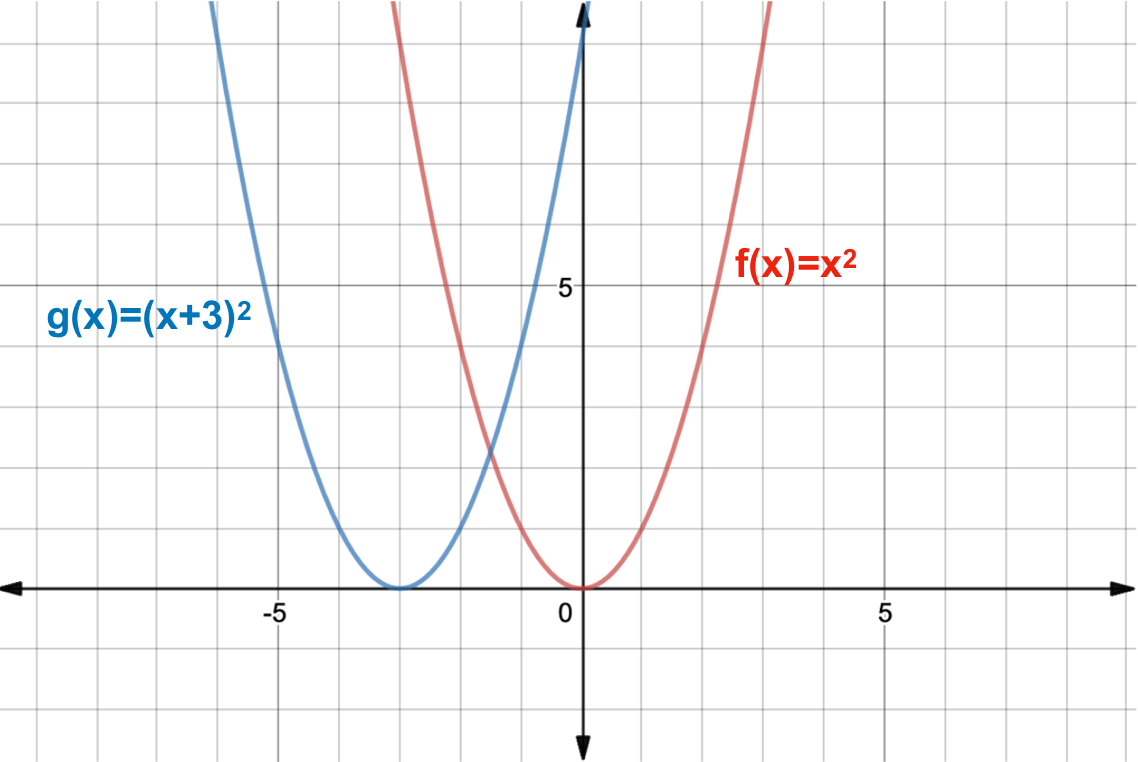
The graph g(x)=f(x+3)=(x+3)2g(x)= f(x+3) = (x+3)^{2} will be the original graph of f(x)f(x) shifted left by 33 units. \\

Graph of y=x^2 and y=(x+3)^2

Graphed with Desmos

The graph g(x)=f(x−3)=(x−3)2g(x)= f(x-3) = (x-3)^{2} will be the original graph of f(x)f(x) shifted left by 33 units. \\

Graph of y=x^2 and y=(x-3)^2

Graphed with Desmos

Reflect about the x-axis

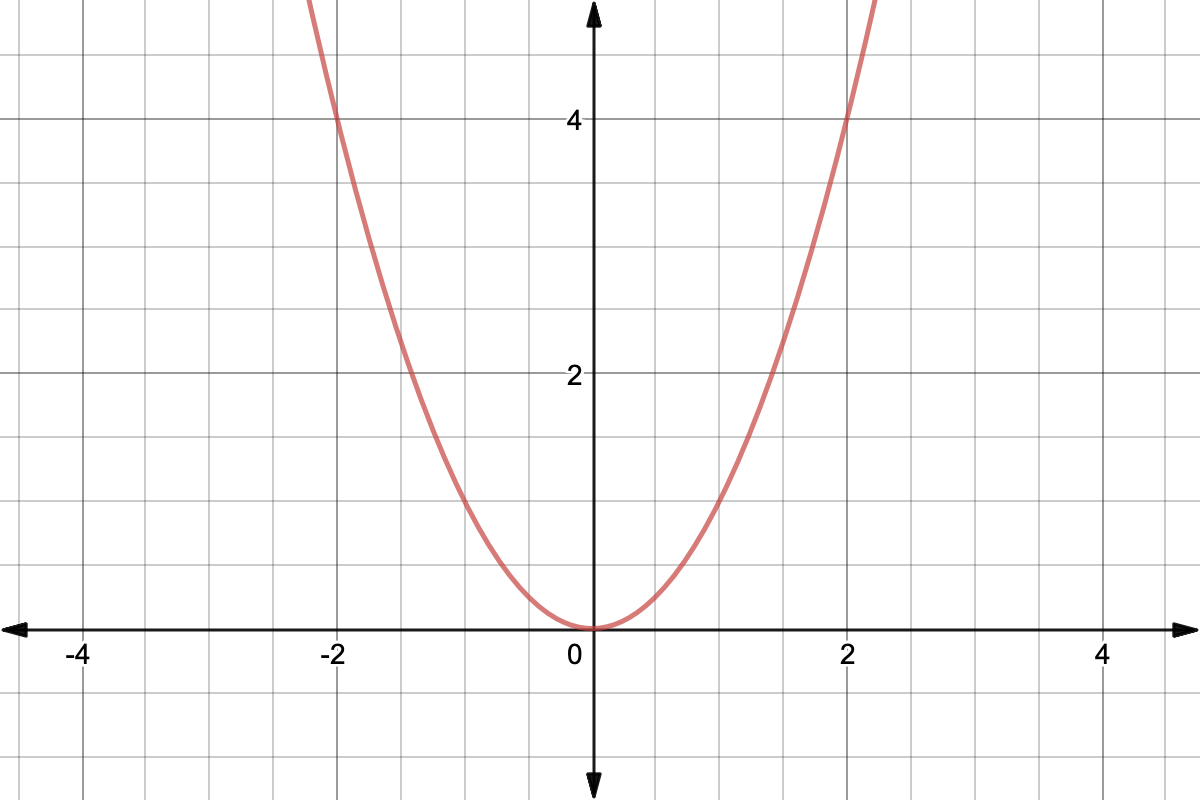
Given the graph of f(x)f(x), −f(x)-f(x) will be the graph of f(x)f(x) reflected about the x-axis. \\ Let’s start with the graph of f(x)=x2f(x)=x^{2}. \\

Graph of y=x^2

Graphed with Desmos

The graph g(x)=−f(x)=−x2g(x)=-f(x)=-x^{2} will be the original graph of f(x)f(x) reflected about the x-axis. \\

Graph of y=x^2 and y=-x^2

Graphed with Desmos

Reflect about the y-axis

Given the graph of f(x)f(x), f(−x)f(-x) will be the graph of f(x)f(x) reflected about the y-axis. \\ Let’s start with the graph of f(x)=xf(x)=\sqrt{x}. \\

Graph of y=sqrt(x)

Graphed with Desmos

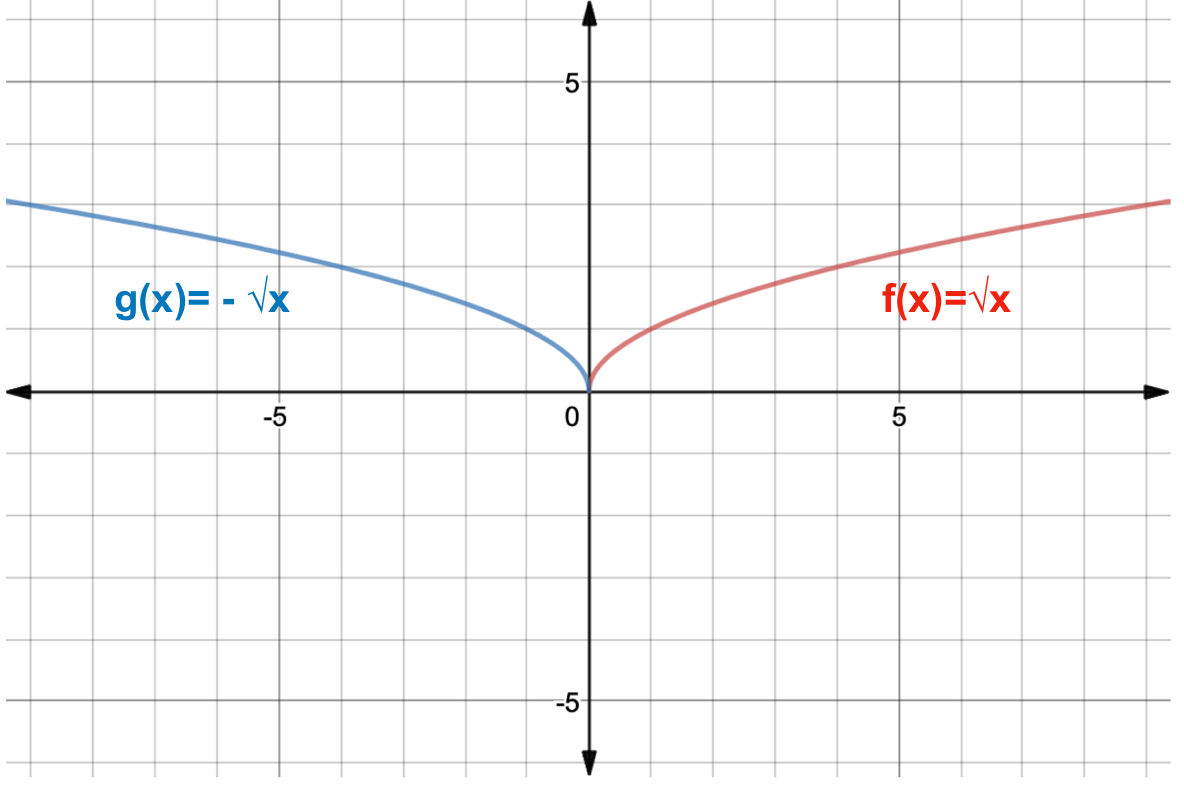
The graph g(x)=f(−x)=−xg(x)=f(-x)=\sqrt{-x} will be the original graph of f(x)f(x) reflected about the y-axis. \\

Graph of y=sqrt(x) and y=sqrt(-x)

Graphed with Desmos

Stretch or Compress Vertically

Given the graph of f(x)f(x), cf(x)cf(x) will be the graph of f(x)f(x) stretched vertically if the value of cc is c>1c>1. cf(x)cf(x) will be the graph of f(x)f(x) compressed vertically if the value of cc is 0<c<10 <c<1. \\ Let’s start with the graph of f(x)=x2f(x)=x^{2}. \\

Graph of y=x^2

Graphed with Desmos

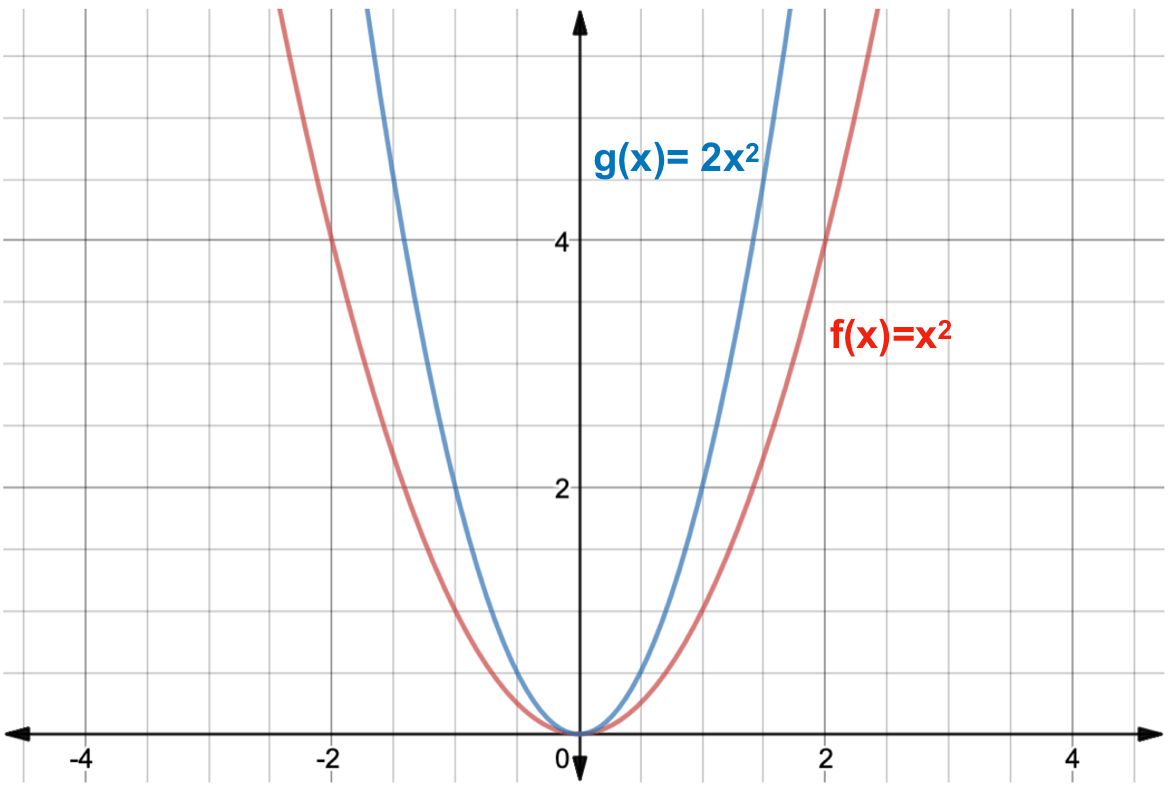
The graph g(x)=2f(x)=2x2g(x)=2f(x)=2x^{2} will be the original graph of f(x)f(x) stretched vertically by 22 units. \\

Graph of y=x^2 and y=2x^2

Graphed with Desmos

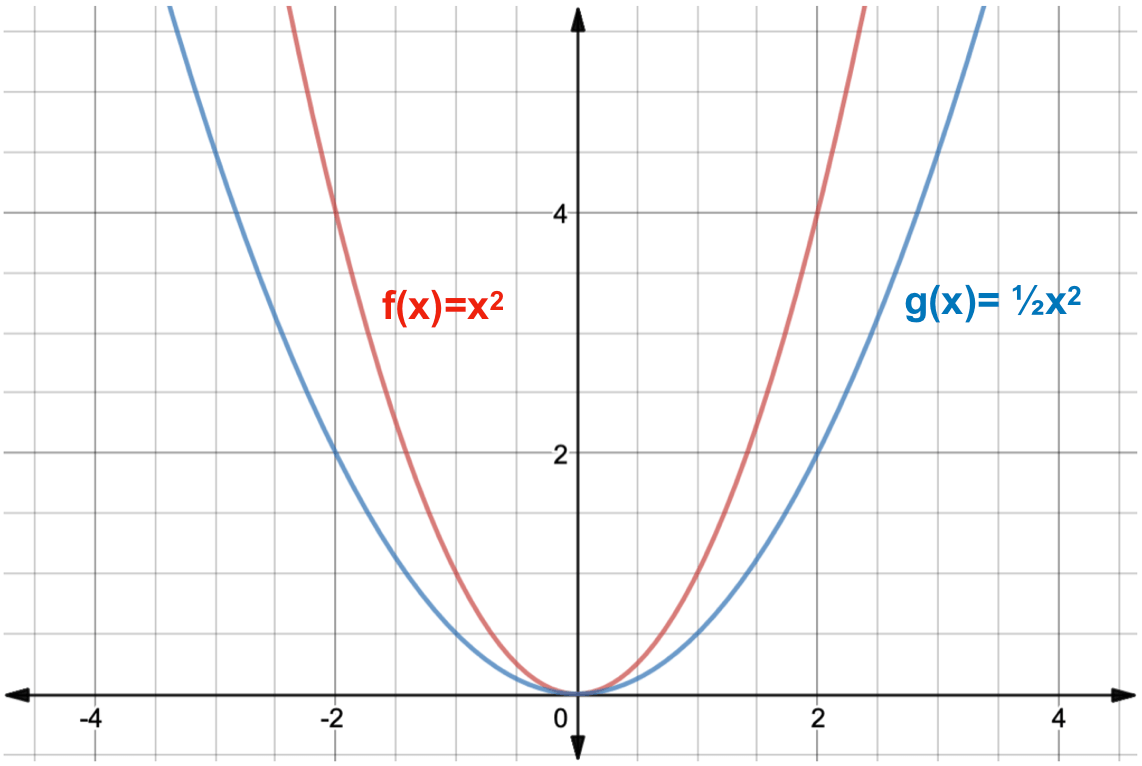
The graph g(x)=12f(x)=12x2g(x)=\dfrac{1}{2}f(x)=\dfrac{1}{2}x^{2} will be the original graph of f(x)f(x) compressed vertically by 22 units. \\

Graph of y=x^2 and y=(1/2)x^2

Graphed with Desmos

Stretch or Compress Horizontally

Given the graph of f(x)f(x), f(cx)f(cx) will be the graph of f(x)f(x) stretched horizontally if the value of cc is 0<c<10 <c<1. f(cx)f(cx) will be the graph of f(x)f(x) compressed horizontally if the value of cc is c>1c>1.

Let’s start with the graph of f(x)=x2f(x)=x^{2}.

Horizontal stretches:

Graph of y=x^2

Graphed with Desmos

The graph g(x)=f(12x)=(12x)2g(x)=f(\dfrac{1}{2}x)=(\dfrac{1}{2}x)^{2} will be the original graph of f(x)f(x) stretched horizontally by 22 units. \\

Graph of y=x^2 and y=(1/2x)^2

Graphed with Desmos

The graph g(x)=f(2x)=(2x)2g(x)=f(2x)=(2x)^{2} will be the original graph of f(x)f(x) compressed horizontally by 22 units. \\ The red graph is the graph of f(x)=x2f(x)=x^2, and the blue graph is the graph of g(x)=(2x)2g(x)=(2x)^{2}.

Graph of y=x^2 and y=(2x)^2

Graphed with Desmos

Illustrated · 1 min

General Translations

Here are the types of translations:

  • Horizontally left
  • Horizontally right
  • Vertically down
  • Vertically up

The general form of the absolute value equation is y=∣x∣y=|x|

A left translation would be shown by y=∣x+a∣ with a>0y=|x+a| \text{ with } a>0

A right translation would be shown by y=∣x+a∣ with a<0y=|x+a| \text{ with } a<0

A downward translation would be shown by y=∣x∣+b with b<0y=|x|+b \text{ with } b<0

An upward translation would be shown by y=∣x∣+b with b>0y=|x|+b \text{ with } b>0

Let's look at each translation of 22 units compared to the original graph of y=∣x∣y=|x| drawn in black.

Left translation 22 units: y=∣x+2∣y=|x+2|

graph of y=|x| and y=|x+2|

made using Desmos

Right translation 22 units: y=∣x−2∣y=|x-2|

graph of y=|x| and y=|x-2|

made using Desmos

Downward translation 22 units: y=∣x∣−2y=|x|-2

graph of y=|x| and y=|x|-2

made using Desmos

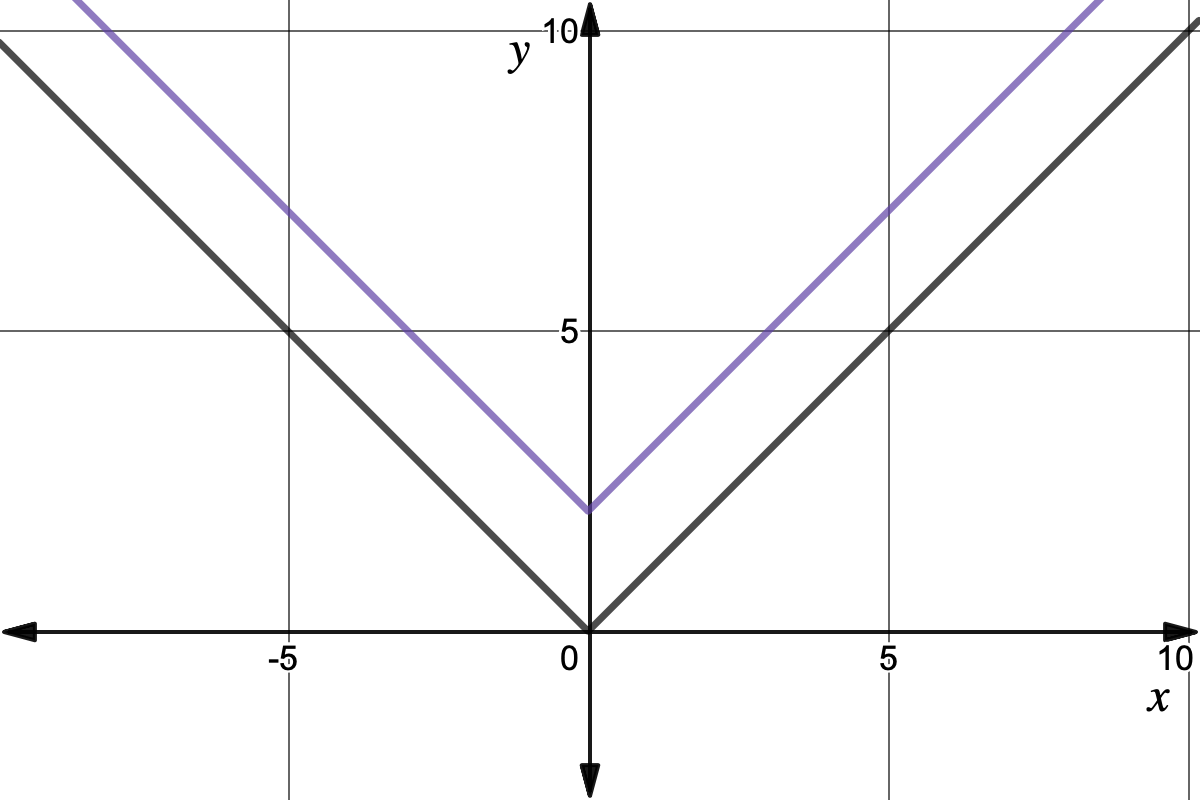
Upward translation 22 units: y=∣x∣+2y=|x|+2

graph of y=|x| and y=|x|+2

made using Desmos

Illustrated · 1 min

Function Transformation

A function transformation changes the way a function looks on a graph.

Function Transformation

Image source: by Anusha Rahman

There are three main types of transformations, which we will dive into deeper in further lessons.

Looking Further

Understanding this concept is important when we tackle more complicated math, like absolute value functions and inverse functions. In many of these more complicated functions, we work from the parent function.

Type a concept, like “slope” or “photosynthesis”.

↑ ↓ to choose · Enter to openSearch explanations and problems