Membandingkan dua set data dengan menggunakan plot kotak

Before this, knowPlot kotak

Illustrated · 1 min

We have already learned how to create box and whisker plots using the upper and lower quartiles and the interquartile range. While just one box and whisker plot can tell us a lot about the dataset, comparing multiple box and whisker plots is very helpful because it can help us contrast the variability of datasets.

Let's look at two example data sets of the amount of apples found in a bushel sold at the store and their respective box and whisker plots:

Data set #1: 32, 40, 26, 41, 29, 17, 35, 33

Data set #2: 12, 9, 36, 21, 19, 22, 27, 14, 11, 30, 16, 42, 25
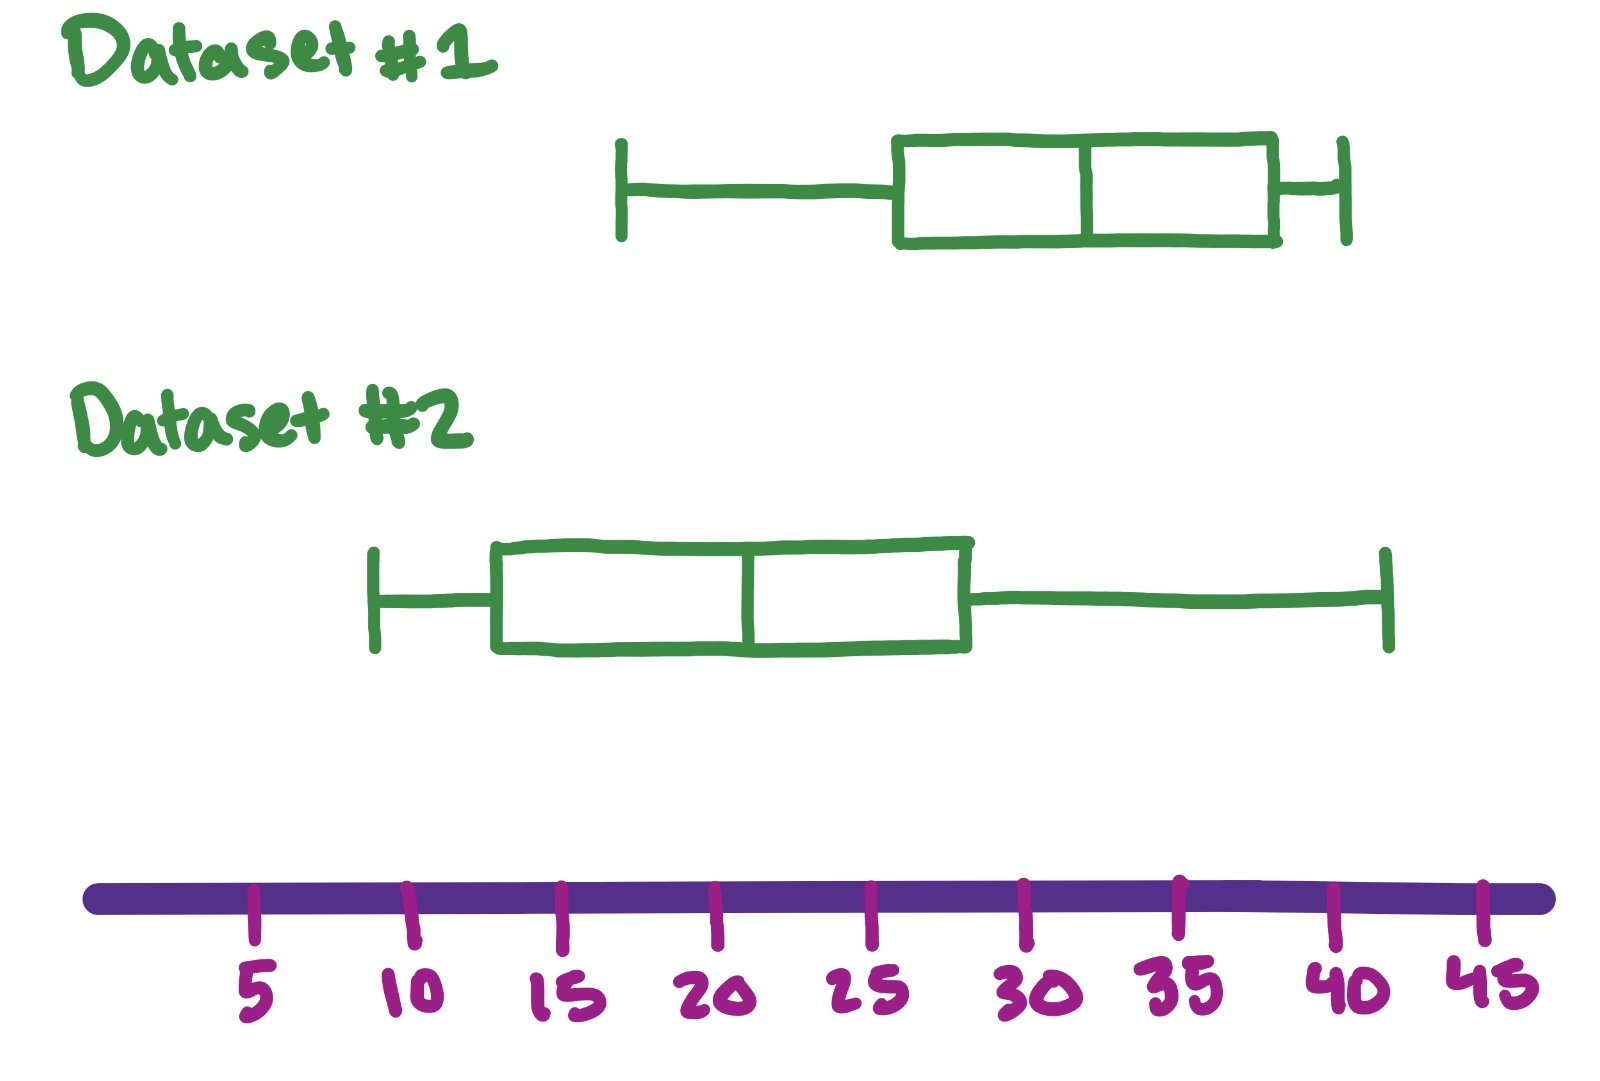
Box and whisker plot of data set #1: 32, 40, 26, 41, 29, 17, 35, 33 and data set #2: 12, 9, 36, 21, 19, 22, 27, 14, 11, 30, 16, 42, 25.

Image source: by Trisha

Now that we have plotted both box and whisker plots, we can analyze them together.

The first aspect to look for is the overall distribution.

Which has a wider/shorter distribution? In our above example, dataset #2 is much wider and spread-out, so the data is more variable.

Do the boxes overlap? Yes, the boxes overlap slightly, meaning their IQR's overlap, so the datasets aren't very different. If the IQRs don't overlap, then the datasets are different.

Is the data skewed? In other words, does the data seem to favor the left side or right side? In our example, Dataset #1 skews left while Dataset #2 skews right.

Next, compare the medians by looking at the middle line of the box and whisker plot.

We can see that Dataset #1 has a larger median than Dataset #2. The medians also do not overlap with the box of the other plot, so we can say that the two groups are different.

Finally, check for outliers. Outliers are denoted by points on the plot, not part of the whiskers.

Using all of this information, we can conclude whether the datasets are different and to what extent.

Video · + 1 min read

(Video) Comparing Box and Whisker Plots

by MooMooMath and Science

In this video by MooMooMath and Science, you will learn how to compare different box plots, also called box-and-whisker plots, to learn more about two data sets.

Summary

You will review the parts of a box plot, including the lower extreme, upper extreme, median, lower quartile, and upper quartile. Each section of the box plot represents 2525% of the data. You will also learn why two box plots need to use the same scale when you compare them.

We can use box plots to quickly compare data sets and answer questions about them. For example, you can compare the extremes to find the smallest or largest value, compare the medians to find which group has a higher typical value, and compare the ranges to find which group has more variety in its data.

Hint: When a question asks which data set has the greatest variety, compare the range by subtracting the smallest value from the largest value.

Illustrated · 1 min

Using Box and Whisker Plots to Compare Data Sets

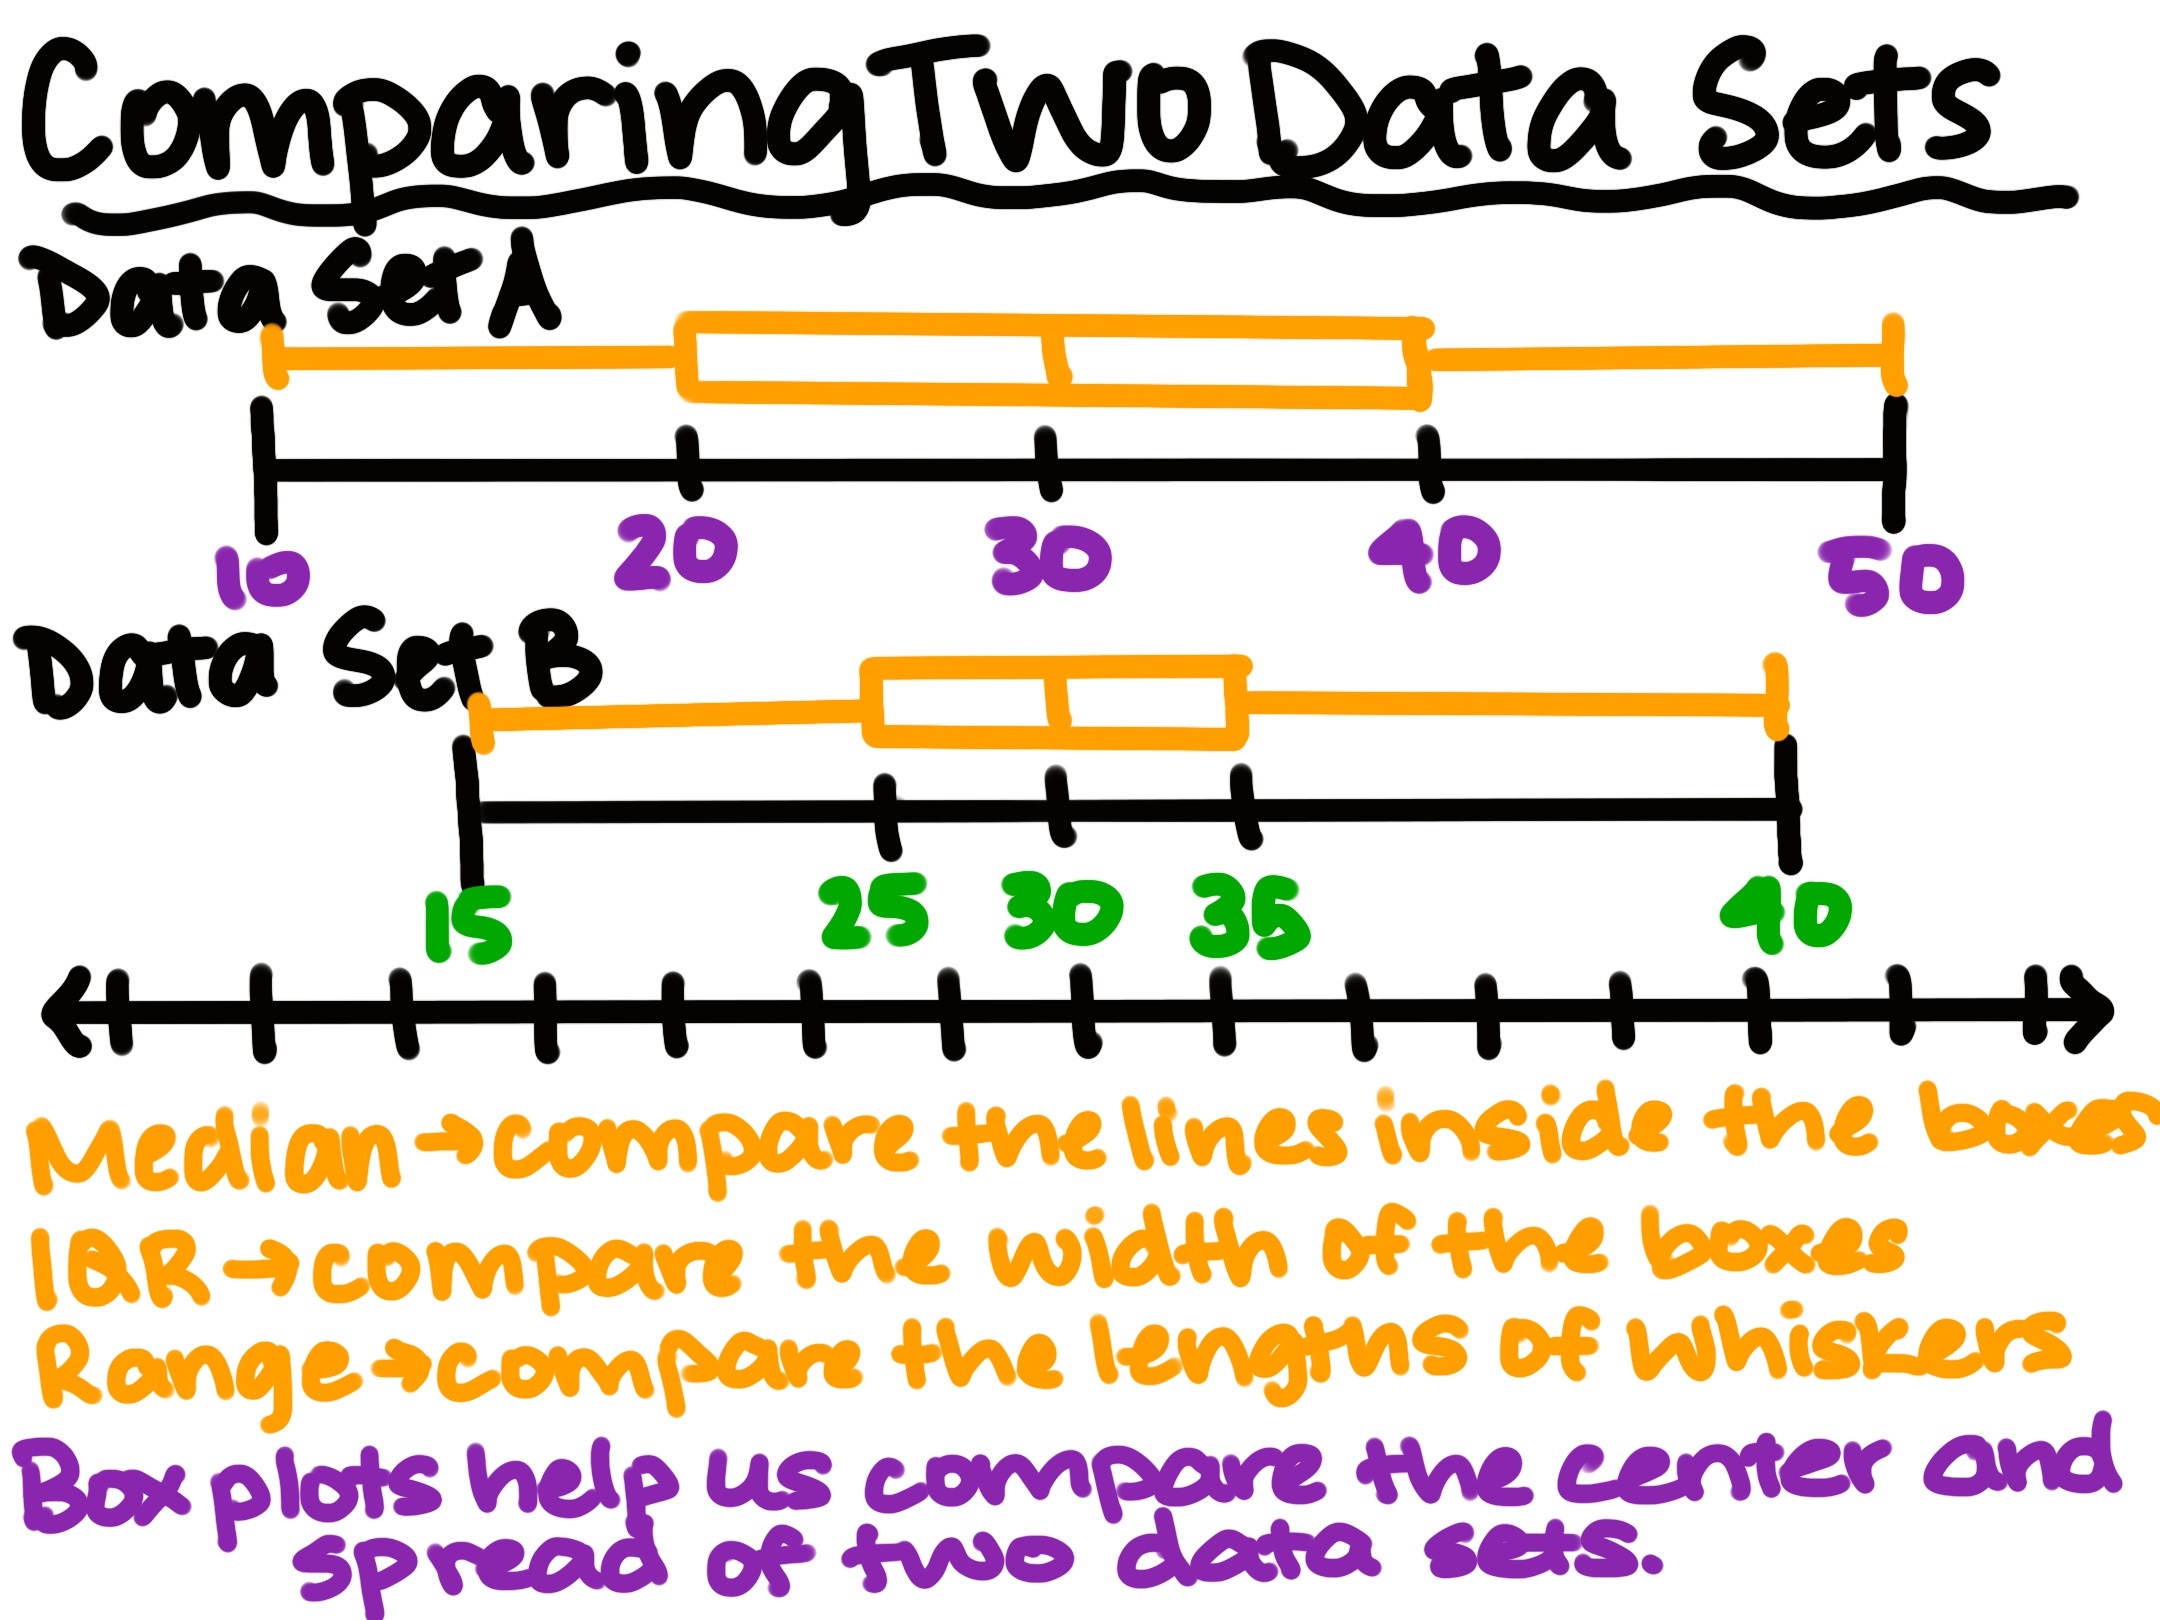
A box and whisker plot is a type of graph that helps us to compare two or more data sets. Each plot shows the center and spread of a data set.

Comparing Two Data Sets
Median: compare the lines inside the boxes
IQR: compare the width of the boxes
Range: compare the lengths of whiskers
Box plots help us compare the center and spread of two data sets.

Image source: by Anusha Rahman

The line inside of the boxes shows the median, which is the middle value. The box shows the middle 50/50/% of the data, also known as the interquartile range (IQR). A wider box means the middle values are more spread out.

The whiskers show how far the data extends from the lowest to the highest value. Longer whiskers can show that the data has more spread. By placing two box plots on the same number, we can quickly compare the medians, IQRs, and rangers. This visual is why box and whisker plots are useful for finding differences between data sets.

Type a concept, like “slope” or “photosynthesis”.

↑ ↓ to choose · Enter to openSearch explanations and problems
