Illustrated · 1 min

Interquartile Range

The interquartile range (IQR) can be described as the "middle 50%" of a dataset, and is equal to the difference between the 75th (upper quartile) and 25th percentiles (lower quartile). It can tell us how variable the middle section of our data is.

IQR=Q3−Q1IQR = Q3 − Q1

##Finding the upper quartile and lower quartile

The upper quartile is the median of the upper half of the data. The lower quartile is the median of the lower half of the data.

A statistician might refer to the IQR to get a more "realistic" look at the data because it does not include outliers (extreme data values) in our data.

The IQR is usually illustrated in box and whisker plots. While we will cover those in a later topic, here is a sneak peak!
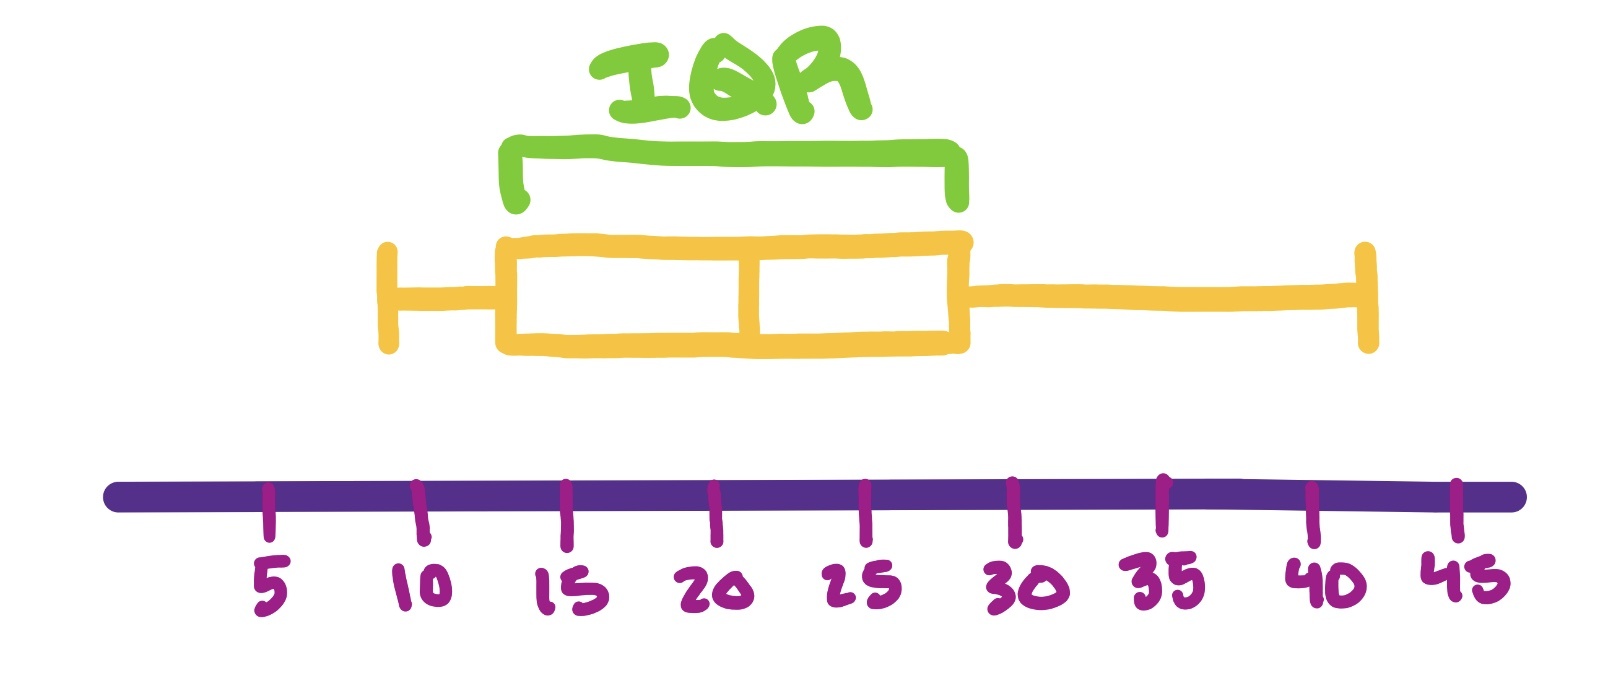
Box and whisker plot over number line, with the interquartile range labeled.

Image source: by Trisha

Video · + 1 min read

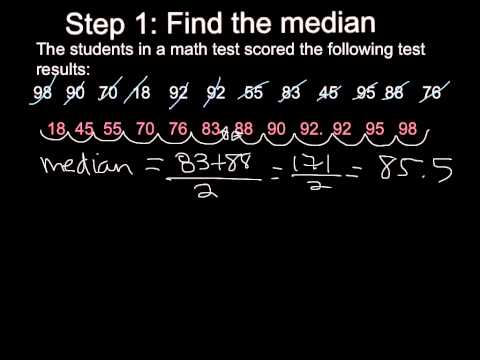
(Video) Quartiles & Interquartile Range

by Colette Tropp

As we've been learning about statistics, we have learned about variability, standard deviation, and range, but now we are going to learn about the interquartile range (IQR).

Follow along with this video by Colette Tropp to learn about how to find the interquartile range.

First, we need to find the lower and upper quartiles. We can do so by finding the median (halfway point) of the entire dataset, then the median of the the two halves of the dataset each. The median of the first half of the dataset is called the lower quartile and the median of the second half of the dataset is called the upper quartile.

Now that we know the upper and lower quartile, we can solve for the interquartile range.

The interquartile range (IQR) = the upper quartile - the lower quartile.

The interquartile range represents the range of the middle half of the data.

Now, work through the practice problem used in the video!

Illustrated · 1 min

Interquartile Range

The interquartile range is a really important when calculating dispersion it tells you the spread of the central portion of the dataset, specifically the middle 50%50\%. We will learn how to find the interquartile range.

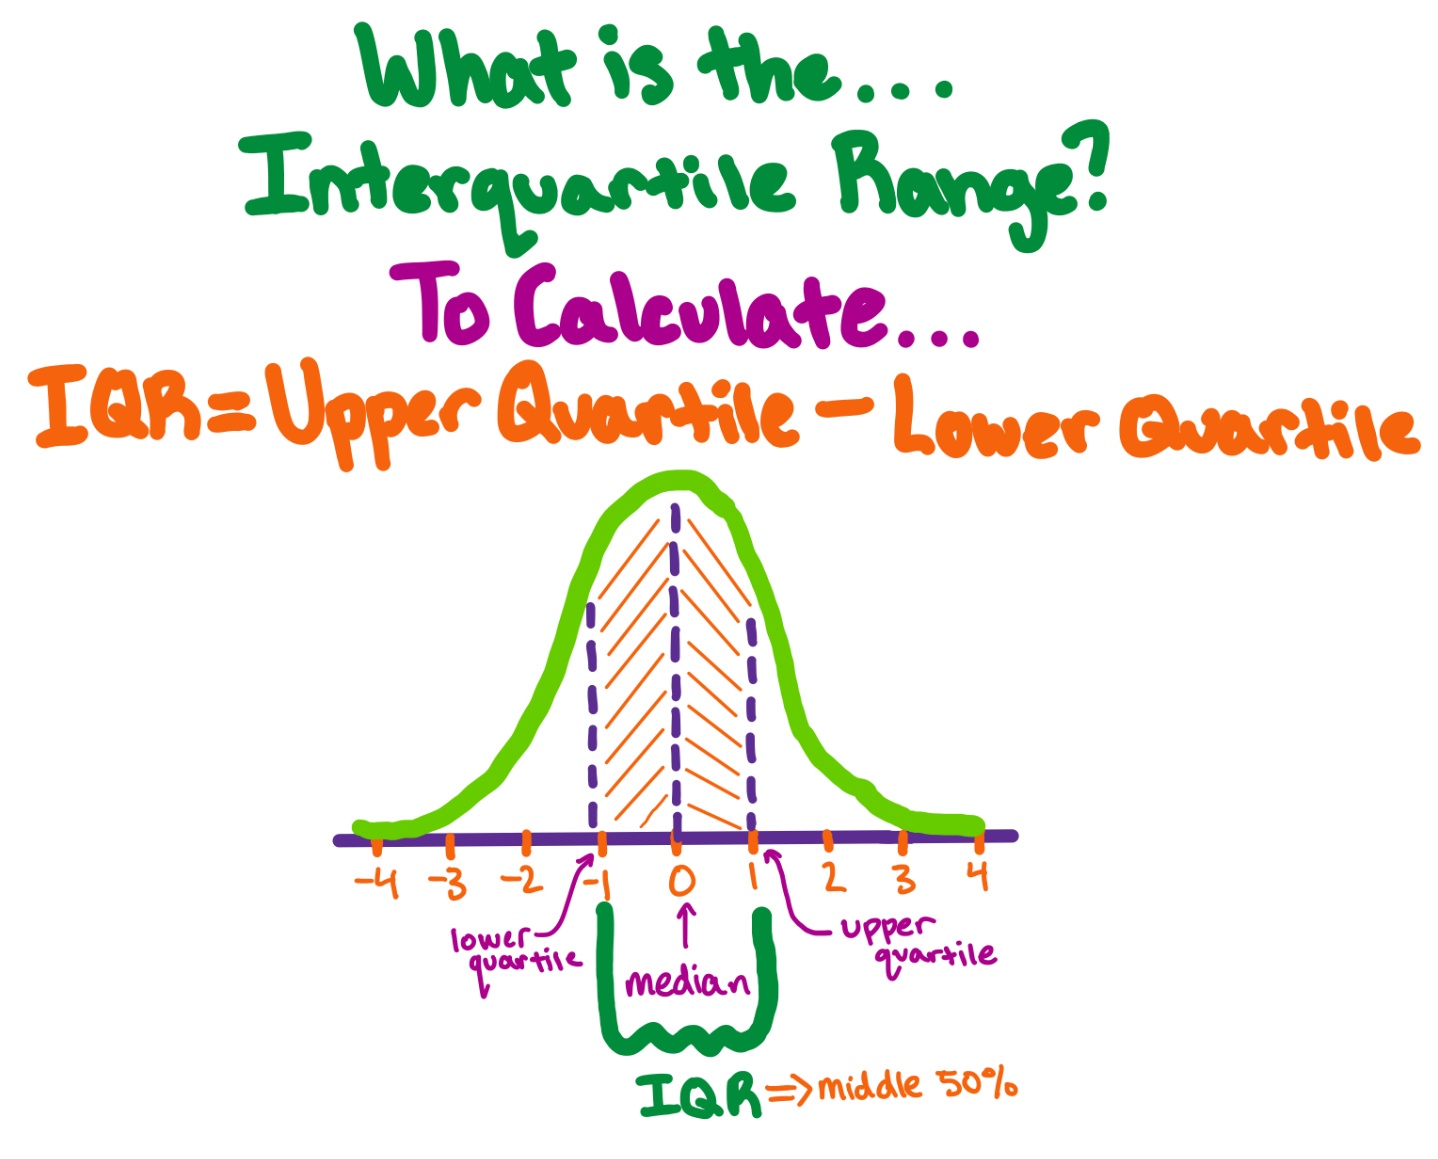
What is the... interquartile range?
To Calculate... IQR = Upper quartile - lower quartile
[graph of IQR labeled on normal distribution. Lower quartile, median, upper quartile, and IQR labeled on graph.]

IQR equals the middle 50% of the dataset.

Image source: by Trisha

It is calculated by subtracting the first quartile (Q11) from the third quartile (Q33), providing insight into the variability within this central range. By identifying Q11 as the median of the lower half and Q33 as the median of the upper half of the data, the IQR effectively captures the range where the majority (50%50\%) of the observations lie.

The IQR is really effective when there are outliers in the dataset, as it's less sensitive to outliers in datasets.

The interquartile range (IQR) gives a simple summary of how the data is spread out, focusing on the middle portion and ignoring extreme values. This helps us better understand the typical values and how spread out they are in the dataset.

Type a concept, like “slope” or “photosynthesis”.

↑ ↓ to choose · Enter to openSearch explanations and problems