Interactive · 1 question

Range

In statistics, the range of a set of data is the difference between the largest and smallest values in a data set. Be careful not to confuse this with our other definition of range (the outputs of a function)!

Let's look at an example!

Given the dataset: {−2,0,1,3,6,13,22-2,0,1,3,6,13,22}, solve for the range.

We know the lowest value is −2-2. The highest value is 2222. Therefore, the range would be 22−(−2)=2422 - (-2) = 24

However, range is not the perfect measure of the variability of a dataset, as outliers can skew the range.

Now it's your turn to try an example!

Cary tracks and records the number of steps she takes each day: 5,498; 8,348; 9,493; 11,284; 13,563; 6,712; 8,395.

What is the range?
Choose one answer

Video

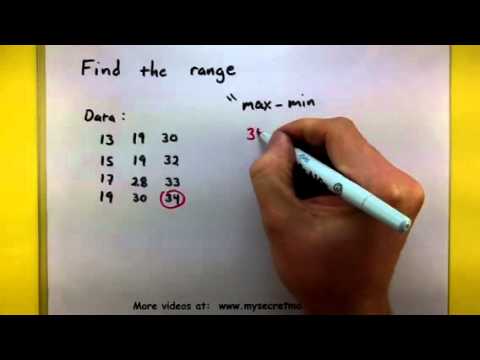
(Video) Statistics - Find the range

by MySecretMathTutor

So far on our journey through statistics, we have learned about sampling in studies, variability, and standard deviation, but now let's learn about finding the range.

Check out this video by MySecretMathTutor to learn how to find the range. Like the video explains, the range is the maximum value minus the minimum value. When given a dataset, the trick is to first identify the maximum and minimum values, then subtract the smallest value from the largest value.

Illustrated · 1 min

Range

This is our next lesson on the measures of central tendency. When we have a set of numbers, we can find the largest data point and the smallest datapoint and find the range of values between them.

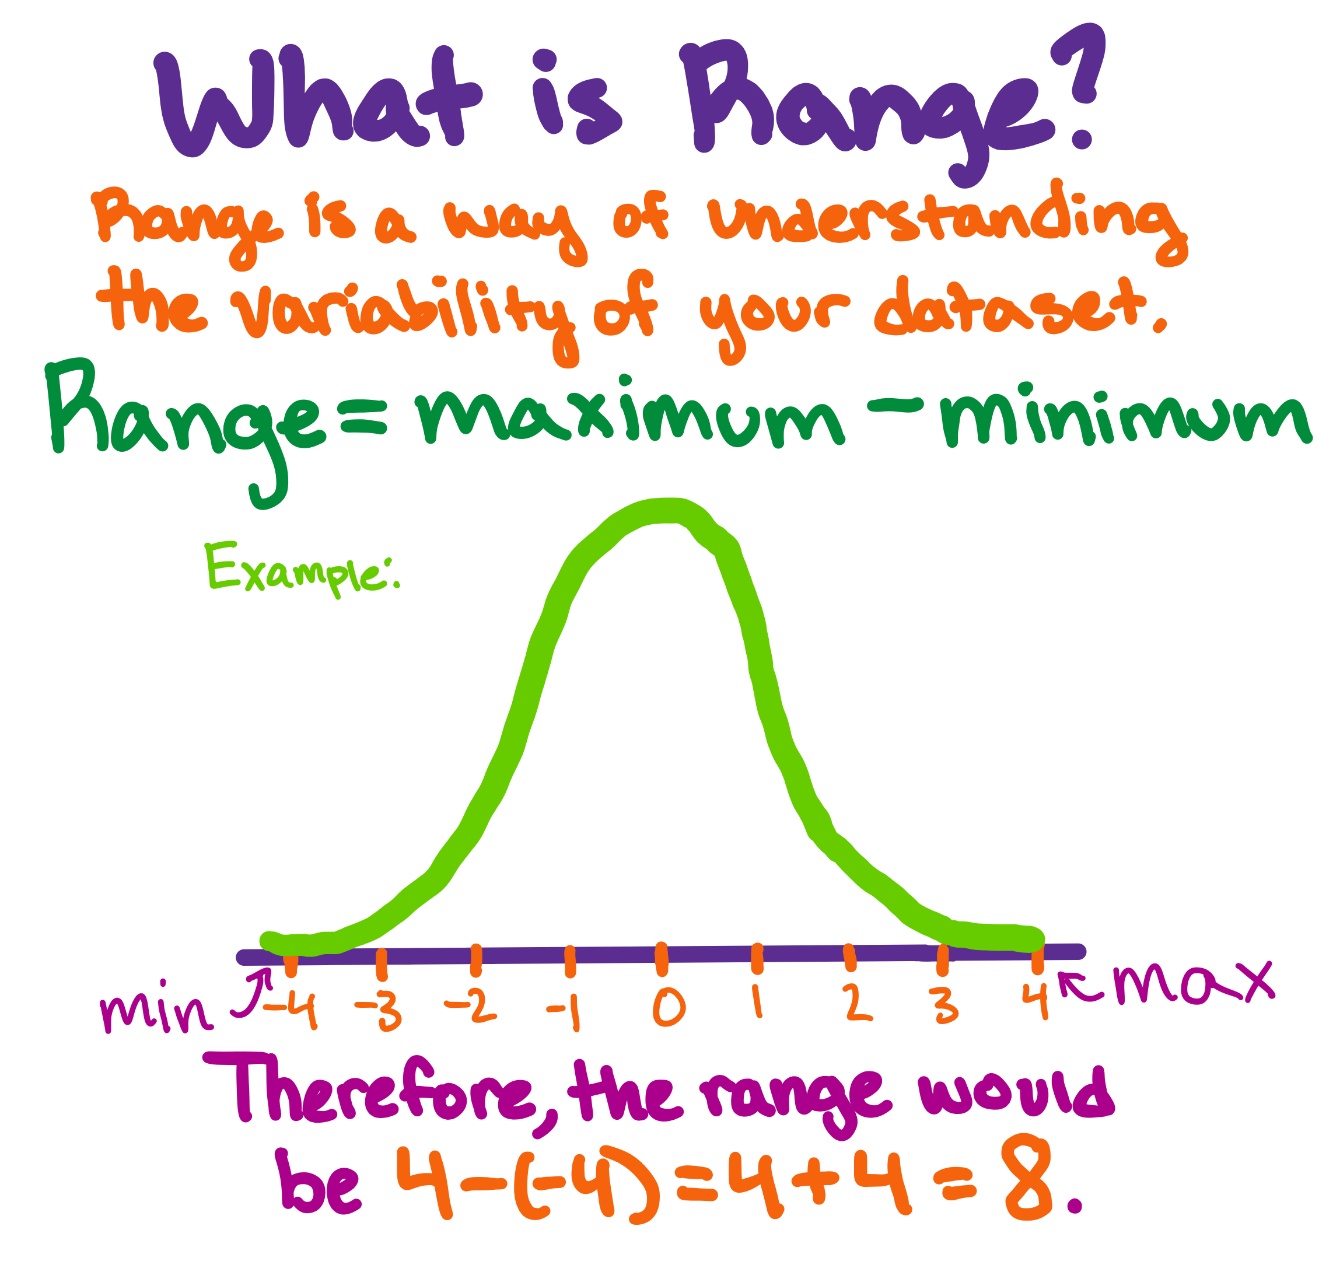
What is Range?

Range is a way of understanding the variability of your dataset.
Range = maximum - minimum

Example: graph of a normal distribution over a number line with the maximum and minimum value labeled. The maximum is 4 and the minimum is -4.

Therefore, the range would be 4-(-4) = 4+4=8.

Image source: by Trisha

Type a concept, like “slope” or “photosynthesis”.

↑ ↓ to choose · Enter to openSearch explanations and problems