Illustrated · 1 min
+2 contributors
Contributors

Box-and-whisker plots
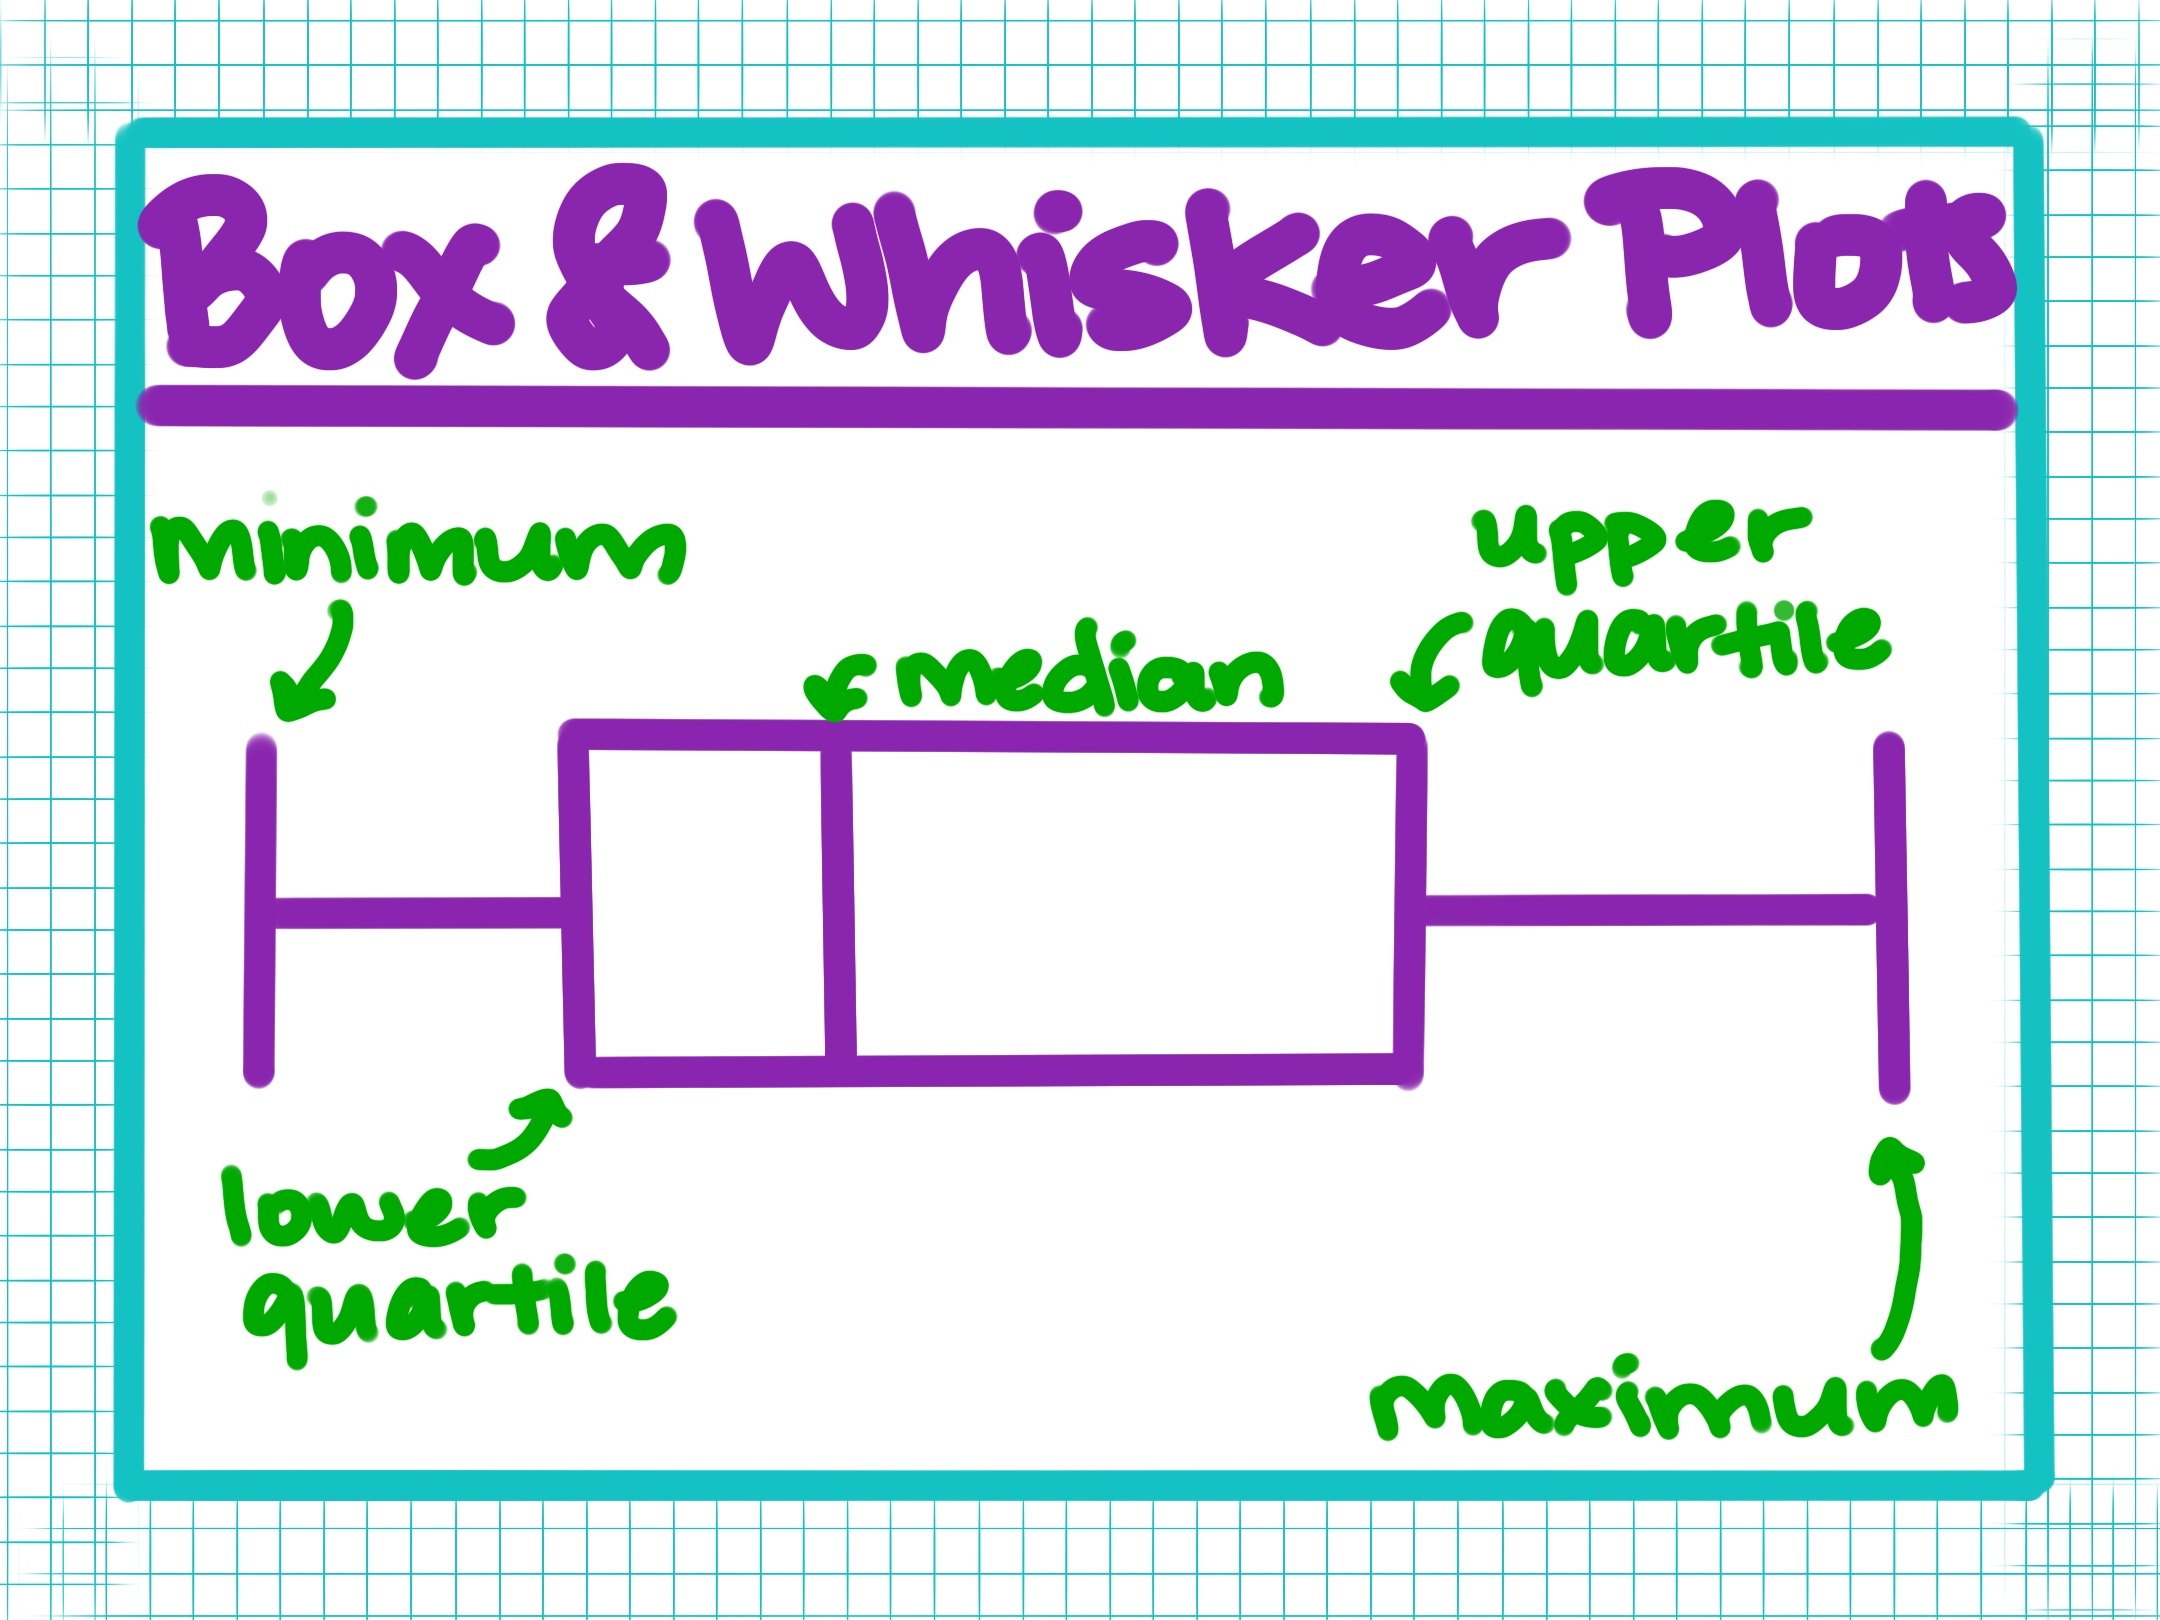
A box-and-whisker plot (sometimes called a boxplot) is a graph that illustrates five values (lower extreme, lower quartile, median, upper quartile, upper extreme).
It is especially useful for indicating whether the data is skewed and whether or not there are outliers present.
In this type of plot:
- the ends of the box are the upper and lower quartiles
- the length of the box spans the interquartile range (IQR)
- the median is marked by a vertical line inside the box
- the whiskers are the two lines outside the box that extend to the highest and lowest values in the data set
- any outliers are indicated as dots outside of the whiskers
- if there are no outliers, the difference between the whiskers is the range
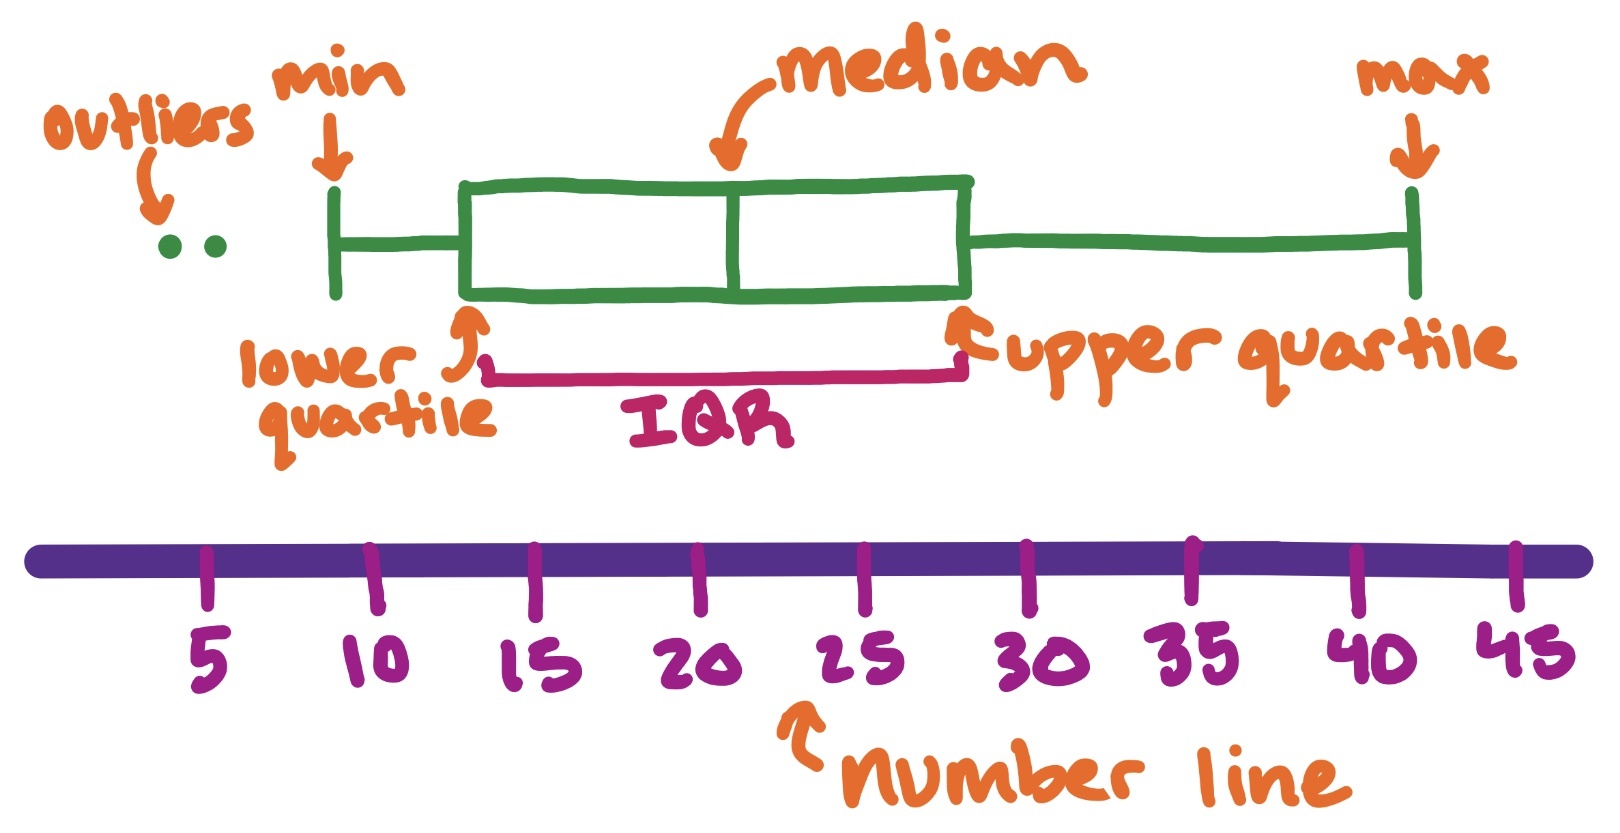
Image source: by Trisha
In the example above, we can see the key features labeled. We can also see that the dataset is skewed to the right.
Box and whisker plots aren't just useful individually; they can also be very informative to compare multiple datasets.