Interactive · 1 question

+1 contributors

Square Root Graphs
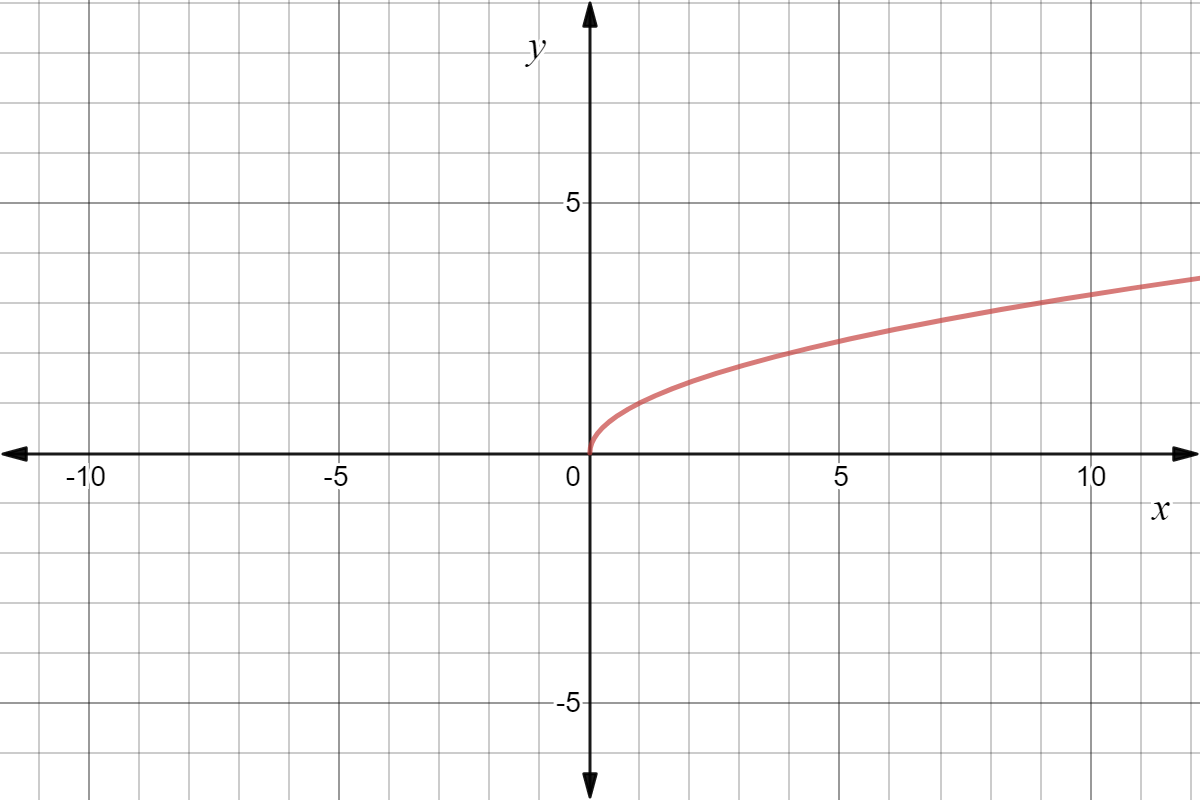
We're going to dive into the details of the square root graph. Let's start by looking at the most basic case, .
Made with Desmos
The graph starts at the point and extends upwards and to the right. Written in interval notation:
This is because of the rules for both square roots and functions. We know that we cannot have a negative underneath the square root (such as ). This means that we will only have positive -values in an unaltered square root function. We also know that a function needs to pass the vertical line test, or in other words, there can only be -value for every -value. This means that we will only use the positive answers for a square root. For example, we will only use when it comes to graphing the unaltered square root function.
Transformations
Square root functions can be transformed the same way any other function can. These can be categorized into shifts, stretches/compressions, and reflections.
Shifts
Shifts can be shown by adding or subtracting. Let's take a look at the graph of the following functions (with matching colors):

Made with Desmos
The above graph shows all of the possible directions of shifts from the parent function .
Stretch/Compress
Stretches/Compressions are done by multiplying. The following functions show a stretch or compression:
Let's look at the following examples on a graph (with matching colors):

Made with Desmos
Notice that the vertical stretch and compression are the extremes. Horizontal stretches and compressions can be a little bit hard to visualize, but they also have a small vertical component when looking at the graph.
Reflction
Reflections are the most clear on the graph but they can cause some confusion. Let's look at the following functions on the graph:

Made with Desmos
The reflections allow the square root graph to go in any direction!
Combinations of Transformations
A quick note about horizontal reflections: reflecting over the -axis makes the horizontal shifts behave the opposite of what you've seen before. Based on the given information it would be easy to think that has a graph that is reflected over the -axis and shifted one unit to the right, but it is actually shifted one unit to the left.

Made with Desmos
We can make some sense of this just by rearranging the function. If we pull out a under the radical, we see something that lines up a little better with the graph: Now we can see the reflection and the shit as two separate parts! Always be sure to watch out for this when dealing with horizontal reflections.
We use this same method when thinking about transformations that include horizontal stretches/compressions. Try out this problem:
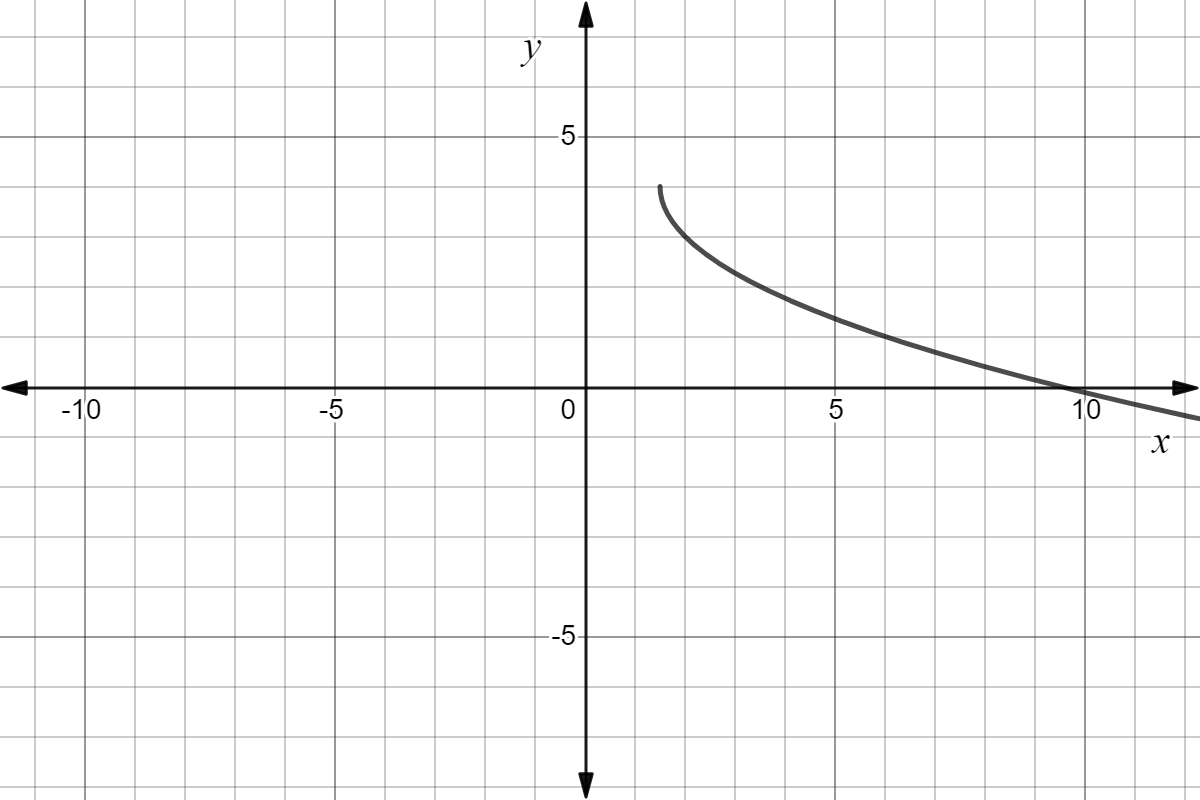
What transformations are shown by the function Select all correct answers.
This function shows a vertical reflection, a horizontal stretch by a factor of , a horizontal shift units to the right, and a vertical shift units upwards. Let's rewrite the function to see the horizontal transformations a little more clearly, then graph it.
Made with Desmos
Now we have the knowledge to make any square root graph! Having a good grasp on the various transformations will help with visualizing and graphing square root functions. You may get stuck or confused at some point, but you can always plug in -values to find the corresponding -values and graph with points!